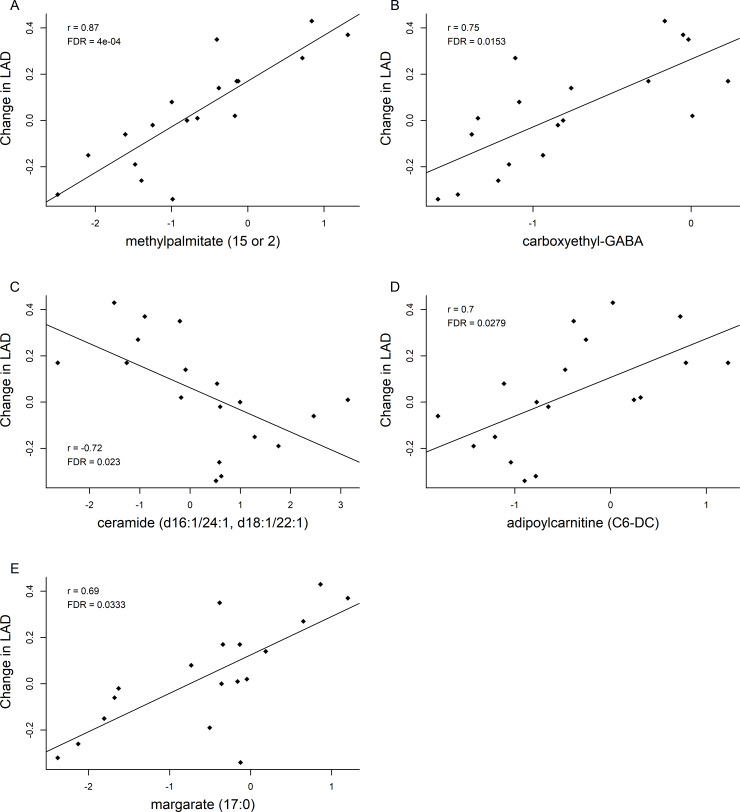
Fig 4.
Scatterplots of changes between left atrial diameter (LAD) and (A) methylpalmitate, (B) carboxyethyl-GABA, (C) ceramide, (D) adipoylcarnitine, and (E) margarate. Correlation coefficients (r) and adjusted p-values (FDR) from Spearman’s correlation analysis are shown in the plots. A linear regression line is also drawn in each plot.

