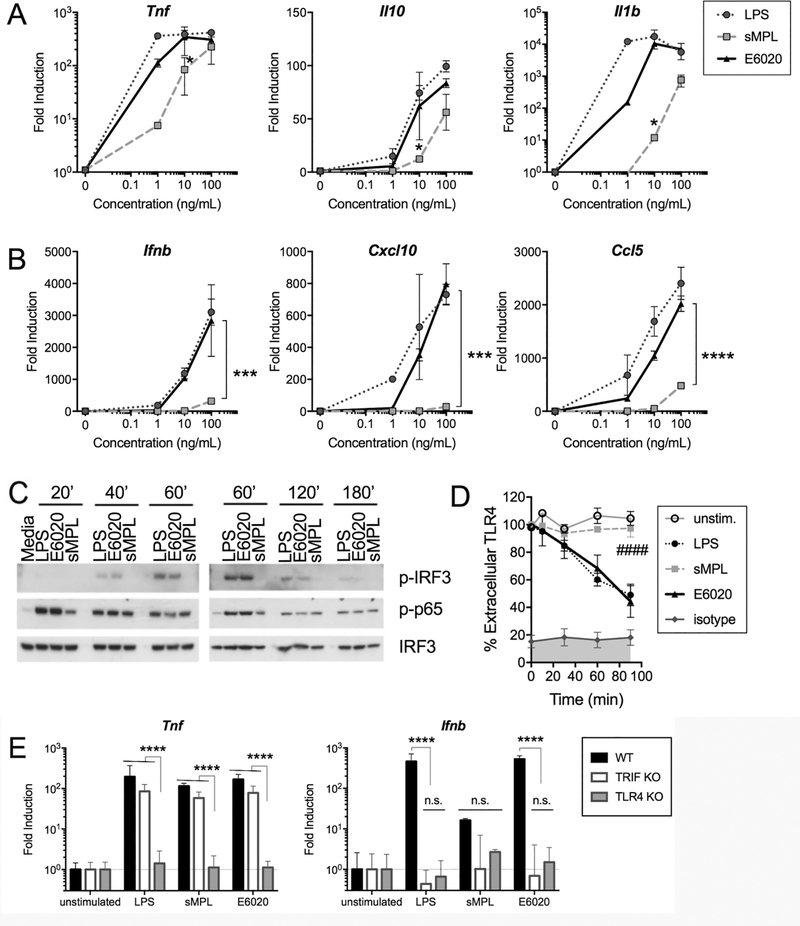
Figure 1. TRIF-dependent genes, IRF3 phosphorylation, and TLR4 internalization are strongly induced in E6020- vs. sMPL-stimulated macrophages.
Macrophages were either medium-treated (“0”) or treated for the indicated times with 1 – 100 ng/mL of LPS (circle, dotted line), sMPL (square, dashed line), or E6020 (triangle, solid line). qRT-PCR was employed to measure fold-induction over medium-treated baseline gene expression (normalized to Hprt mRNA expression) of (A) MyD88-dependent genes Tnf, Il10, and Il1b mRNA, and (B) TRIF-dependent genes Ifnb1 and Cxcl10, and MyD88-TRIF co-dependent gene Ccl5 mRNA. Each graph shows the arithmetic mean ± SEM of a representative experiment of 2–4 separate experiments. Preliminary time-course experiments for each gene were performed and the maximum gene expression time chosen for dose response curves: Tnf, Il10, and Ifnb1 mRNAs were harvested at 2 h, Il1b and Cxcl10 mRNAs were harvested at 4 h, and Ccl5 mRNA was harvested at 24 h. Dose response data were analyzed by One-Way ANOVA with post-hoc multiple comparison analyses; E6020 vs. sMPL A: p = 0.0167 (Tnf), p = 0.0005 (Il10), p = 0.0048 (Il1b), B: p ≤ 0.0001 (Ifnb1, Cxcl10, and Ccl5). (C) Macrophages were treated with 100 ng/mL of the indicated TLR4 agonists and samples collected at the indicated time points (0 – 180 minutes). Western analysis was carried out using anti-phospho-IRF3 antibodies, anti-phospho-p65 antibodies, and anti-total IRF3 antibodies. (D) Macrophages were cultured overnight in flow cytometry tubes, and either left untreated or stimulated with 100 ng/mL of LPS, sMPL, or E6020 for 30 – 90 minutes. At each time point, cells were rapidly chilled to prevent further internalization of TLR4, surface-stained with PE-rat IgG2a,κ anti-mouse CD284 (TLR4; clone SA15–21) or isotype control (clone RTK2758), and analyzed by flow cytometry. The percentage of TLR4 remaining on cell surface based on median PE-intensity is shown as arithmetic mean ± SEM of 3 or more independent experiments. TLR4 internalization rates (linear regression model with TLR4/MD2 surface staining levels at 0 min defined as 100%) of the 4 treatment groups were analyzed by One Way ANOVA (p < 0.0001) with Holm-Sidak’s multiple comparsion post-hoc analysis: ####, LPS or E6020 vs. unstimulated cells or sMPL p < 0.0001. (E) C57BL/6J, TRIF−/−, and TLR4−/− macrophages were stimulated with 100 ng/mL of the respective TLR4 agonists and cytokine expression (Tnf, MyD88-dependent; Ifnb, TRIF-dependent) measured by qRT-PCR relative to Hprt. Differences were assessed by ANOVA with Holm-Sidak posthoc analyses; ****, p < 0.0001.

