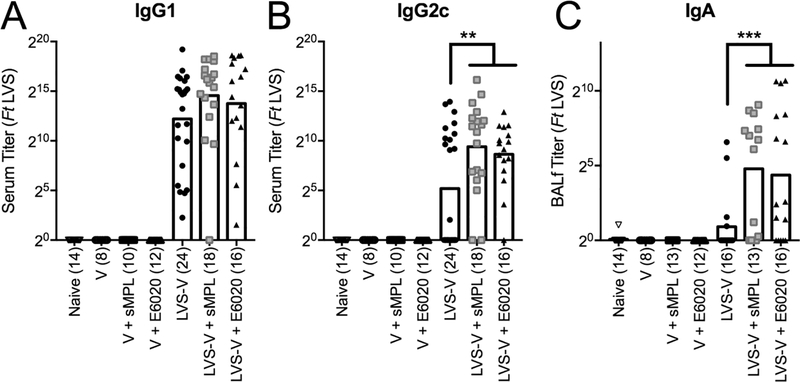
Figure 5. sMPL and E6020 induce similar levels of serum and mucosal antibody responses in the Ft LVS-V nanoparticle immunization model.
Mice were immunized i.p./i.n., in weeks 0 and 2, with PBS (open down-triangle), V (open circle), V+sMPL (open square), V+E6020 (open up-triangle), LVS-V (filled circle), LVS-V+sMPL (grey square), or LVS-V+E6020 (filled up-triangle). As all the vaccine ‘non-responders’ fall on the x-axis, the number of mice in each group (n) is included in parantheses. (A, B) Sera and (C) BALf were harvested in week 4 and analyzed by ELISA for Francisella tularensis (Ft)-specific (A) IgG1, (B) IgG2c, and (C) IgA. Each symbol represents the antibody titer from one mouse, and bars show geometric mean of the treatment groups. Data were Log-transformed and analyzed by One-Way ANOVA with Holm-Sidak’s multiple comparsions post-tests for LVS-V alone vs. LVS-V+sMPL or LVS-V+E6020, and LVS-V+sMPL vs. LVS-V+E6020: (A) IgG1: none significant; (B) IgG2c: p = 0.0012 (LVS-V ± sMPL), p = 0.0089 (LVS-V ± E6020); (C) BALf IgA: p = 0.0002 (LVS-V ± sMPL), p = 0.0003 (LVS-V ± E6020).

