Figure 1.
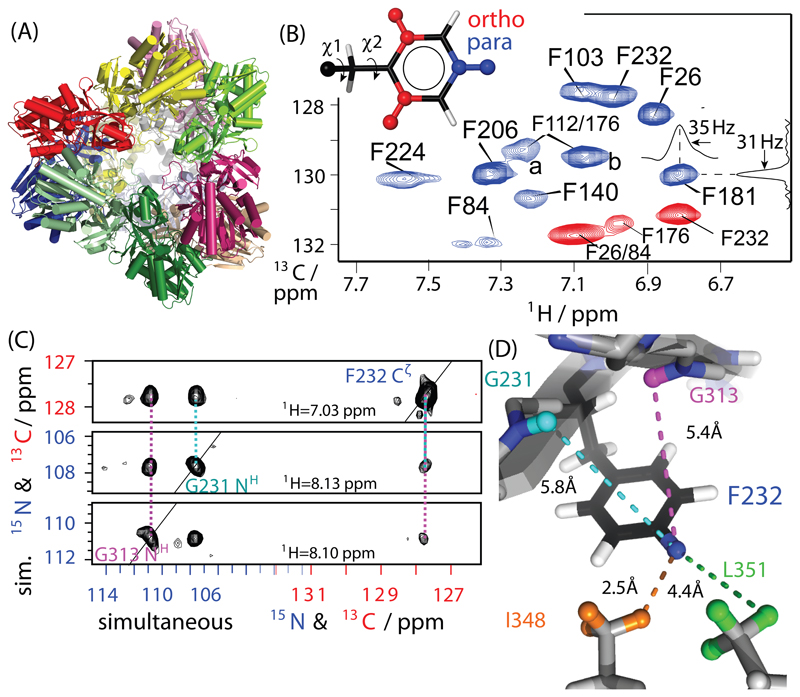
Proton-detected correlation spectra of the 468 kDa aminopeptidase TET2. (A) Cartoon representation of TET2; different subunits (39 kDa each) are shown in different colors. (B) 1H-13C dipolar-coupling based 2D correlation spectra of para-1H-13C (blue) and ortho-1H-13C (red) Phe-labeled TET2 samples, obtained at 55 kHz MAS and a static magnetic field of 14.1 T. The assignment was obtained from mutagenesis and RFDR experiments. Typical line widths are of the order of ~35 Hz in 1H and ~30 Hz in 13C. (C) Example strips from through-space 1H-1H RFDR TET2 with residue-specific assignments, obtained from a three-dimensional H-(C/N)-(C/N) experiment with simultaneous 13C/15N frequency editing in indirect dimensions, applied to a sample labeled on para-CH sites and Ile, Val, Leu 13CHD2 methyl groups. All pulse sequences used in this study are shown in Figure S2. All detected distance restraints involving para-CH sites and ortho-CH sites are shown in Figures S2 and S3, respectively.

