
Figure 2.
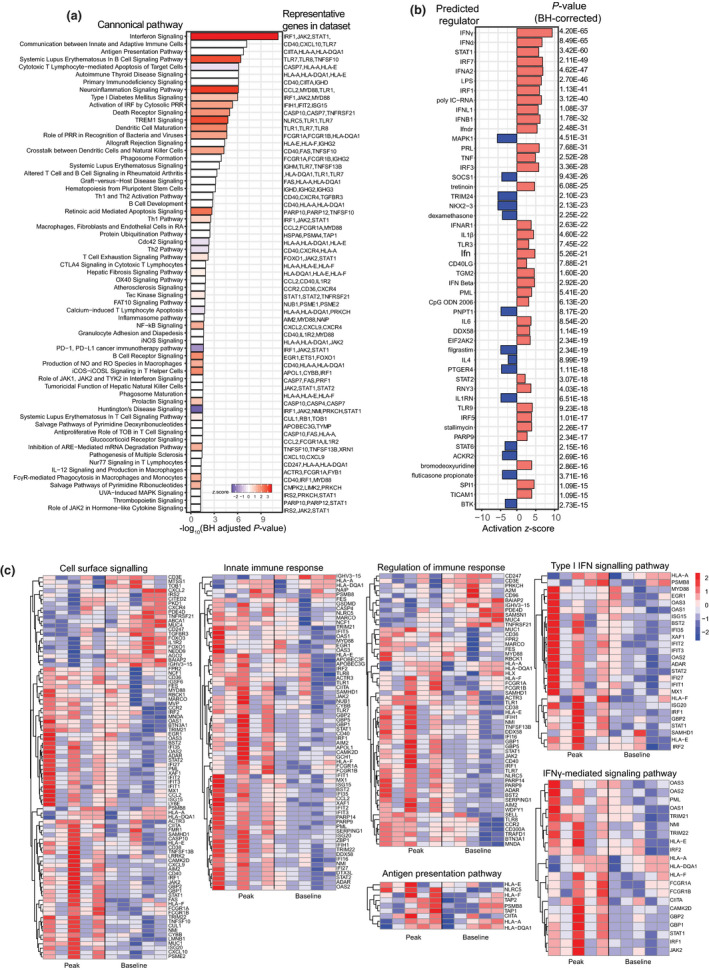
Transcriptional profile of monocytes after primary P. falciparum infection (IBSM cohort). (a) Canonical pathway analysis performed by IPA (Ingenuity Pathway Analysis), Benjamini–Hochberg‐adjusted significant pathways are shown, bar colour indicates activation z‐score (blue = reduced, white = 0 or no score and red = increased). (b) Predicted upstream regulators induced analysis performed using IPA, and red bars indicate activated, blue bars indicate inhibited, Benjamini–Hochberg‐adjusted P‐values. (c) Normalised gene expression of genes involved in enriched pathways represented in heat maps. Each column is one volunteer at ‘peak infection’ and ‘baseline’ (before infection). Red indicates increased gene expression, and blue indicates reduced gene expression. For all analyses, DEG input FDR < 0.01, n = 5 paired samples. DEGs, differentially expressed genes; FC, fold change; FDR, false discovery rate.