
Figure 6. Analysis of apoptosis induced by compounds P10 and P19 on CEM cells.
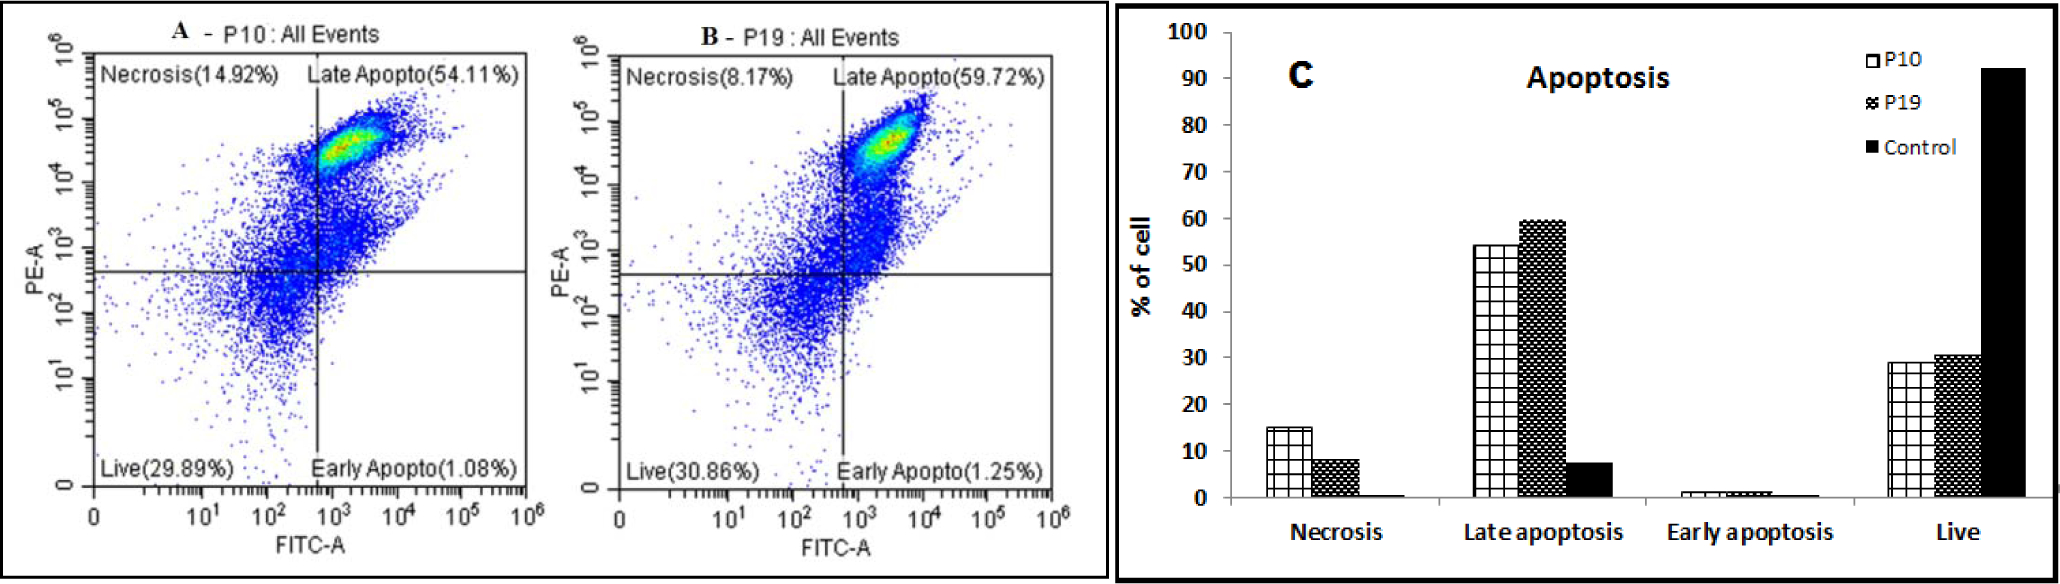
(A-B) Cytograms of test compounds P10 and P19, respectively. CEM cells were treated with IC50 concentration of compounds P10 (A) and compound P19 (B) for 24 h. (C) Graphical representation of apoptotic events of control (1% DMSO), P10-treated and P19-treated cells.