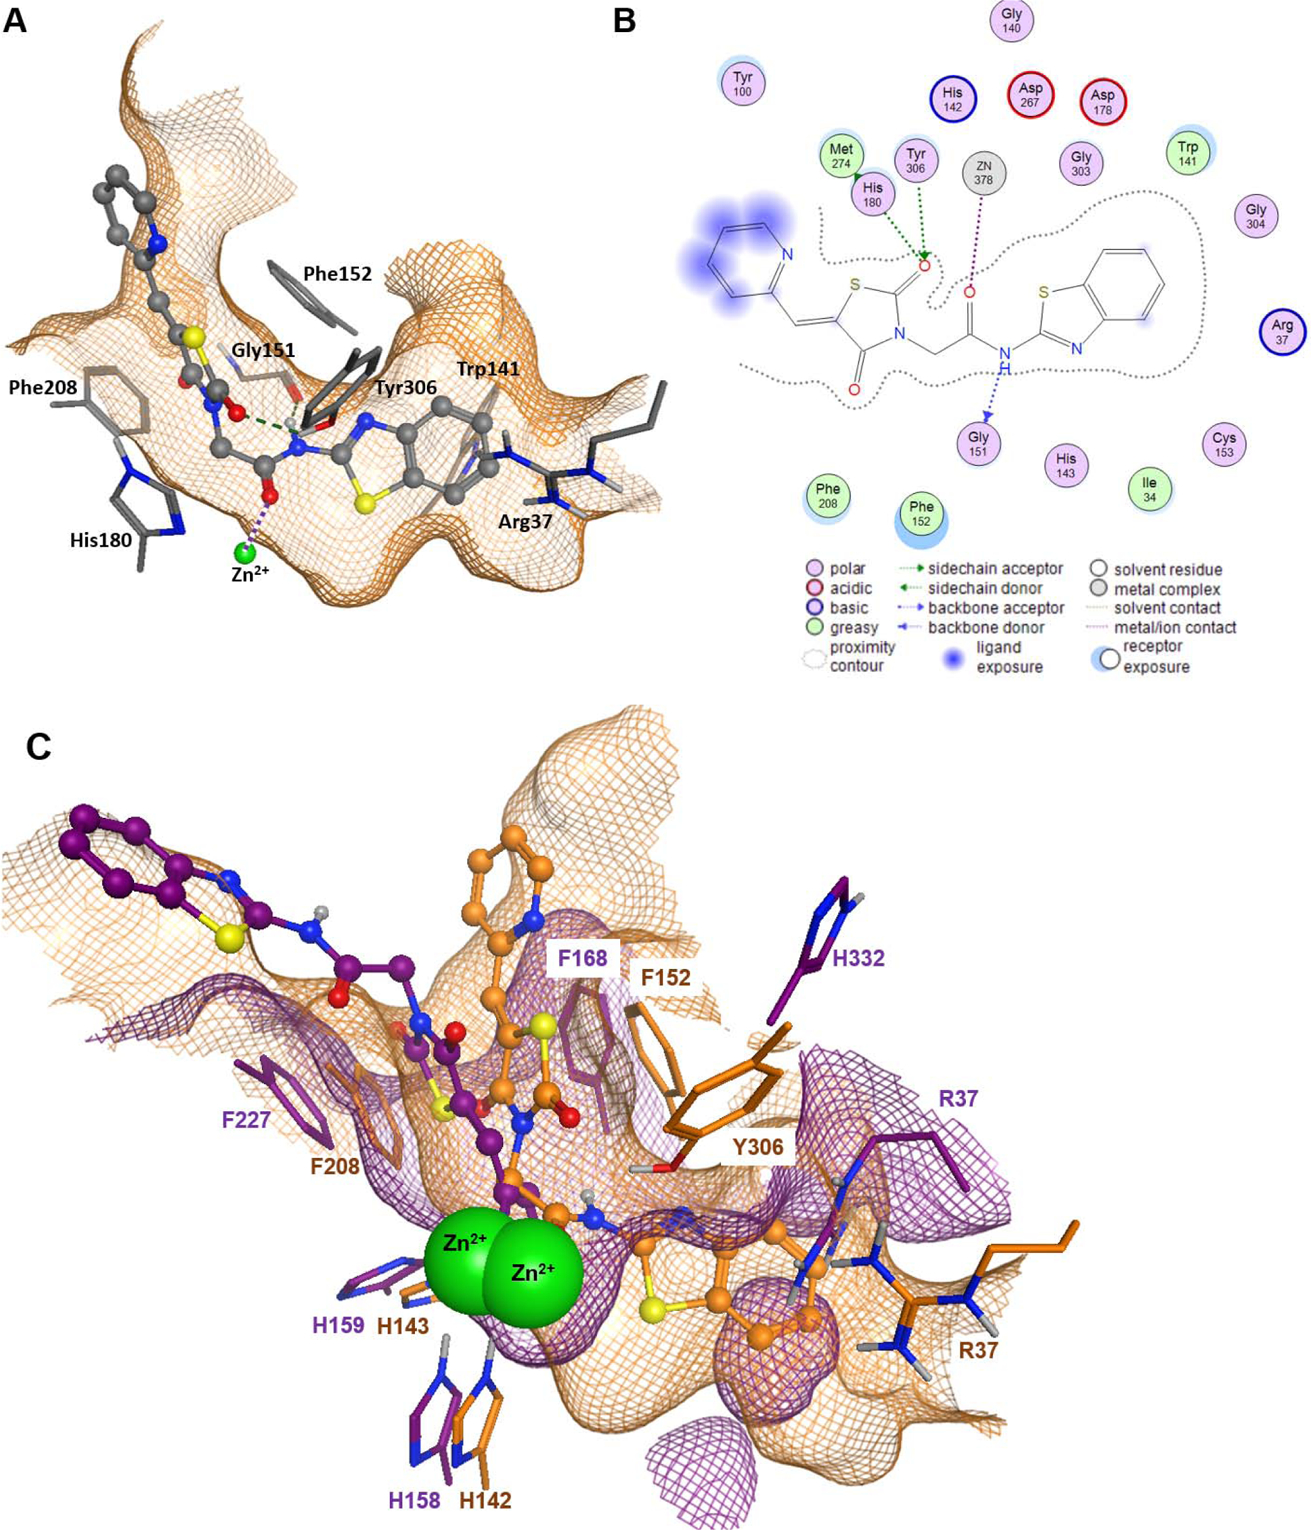
Figure 7.

Docking analysis of compound P19 on HDAC8 (PDB ID 1T69) and HDAC4 (PDB ID 2VQJ). A) 3D binding pose of P19 (stick-and-ball model) within the binding pocket of HDAC8. B) 2D ligand interactions between P19 and HDAC8. Hydrogen bonds are indicated by dashed green lines (A) or dotted green or blue arrows (B) and metal ion contacts are shown as dotted magenta lines. C) Superposition of docking poses of P19 in the binding pocket of HDAC8 (PDB ID 1T69, orange) and HDAC4 (PDB ID 2VQJ, magenta). Green spheres represent the catalytic zinc ion of both structures. The amino acids are annotated according to the respective PDB file. The meshed surfaces indicate the respective binding pocket surfaces of HDAC8 (orange) and HDAC4 (magenta).
