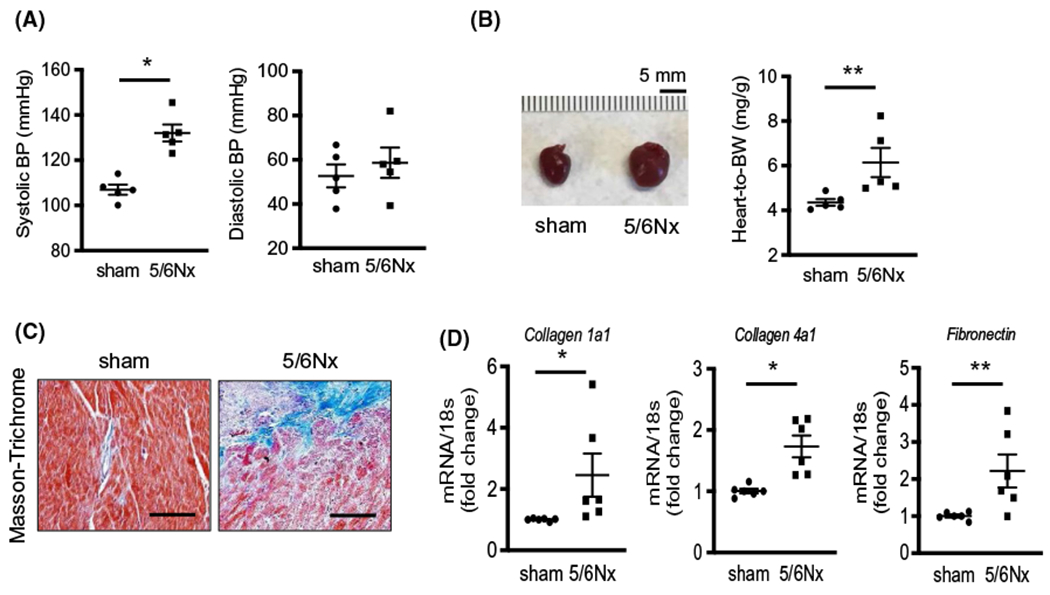
FIGURE 1.

Uremic cardiomyopathy is characterized by hypertension, cardiac hypertrophy, and fibrosis. Sham and 5/6Nx mice were sacrificed and samples were harvested at 8 weeks after CKD was produced. A, Systolic and diastolic blood pressure (BP) were measured by tail-cuff method in sham and 5/6Nx mice. B, Pictures of mouse heart and heart weight (mg) which was normalized by body weight (BW) (g) at sacrifice. C, Masson’s Trichrome staining in mouse heart tissues. Fibrosis is indicated by blue color. Pictures were observed by ×200 magnification. Scale bar is 100 μm. D, Quantitative mRNA expression in mouse hearts performed by real-time PCR. Individual gene expression was calculated by ΔΔcq and standardized by housekeeping gene 18s. All data: mean ± SEM (N = 5). *P < .005, **P < .05 by two-tailed student’s t test
