
FIGURE 2.
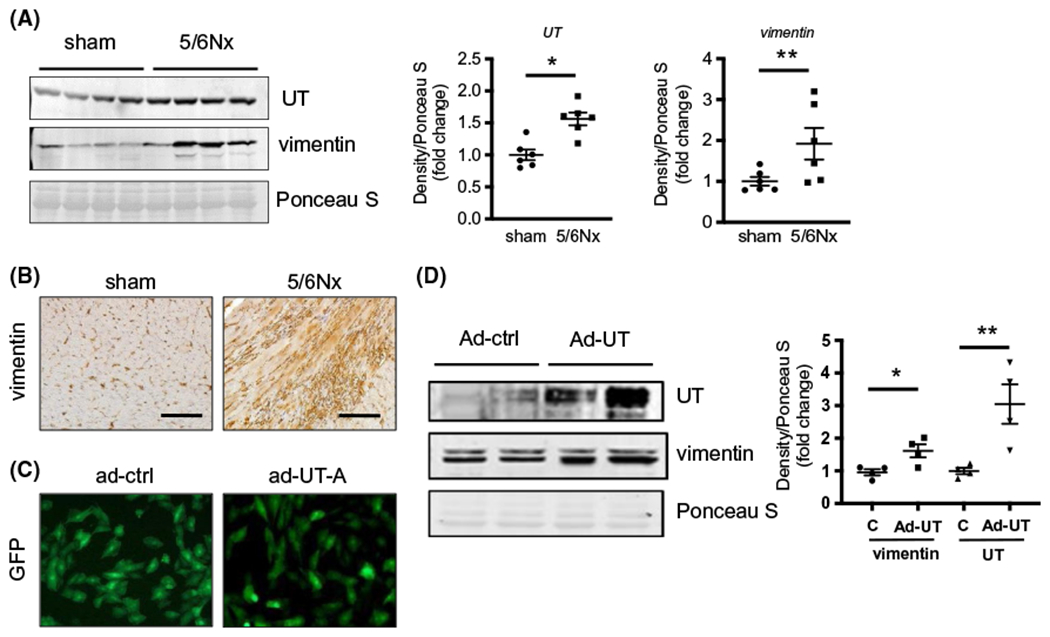
Cardiac fibrosis in uremic heart was associated with upregulation of UT and vimentin expression. A, Western blot of lysates from sham and 5/6Nx mouse hearts probed for UT-A and vimentin proteins. The right point graphs show the levels of each protein in the sham group compared with the level in the 5/6Nx group (designated as one-fold). Data: mean ± SEM (N = 6). *P < .005, **P < .05 by two-tailed student’s t test. B, Immunohistochemistry staining for vimentin (brown) in mouse heart tissues. All pictures were observed by ×200 magnification. Scale bar is 100 μm. C, Immunofluorescence images for GFP in H9c2 cells. Left panel is H9c2 cells transduced with adenovirus (ad)-GFP and right is ad-UT-A/GFP. Pictures of these cells were taken 48 hours after virus transduction. D, Western blot of lysates from H9c2 cells 48 hours after transduction. Data: mean ± SEM (N = 4). *P < .005, **P < .05 vs H9c2 cells with ad-UT-A treatment by one-way ANOVA