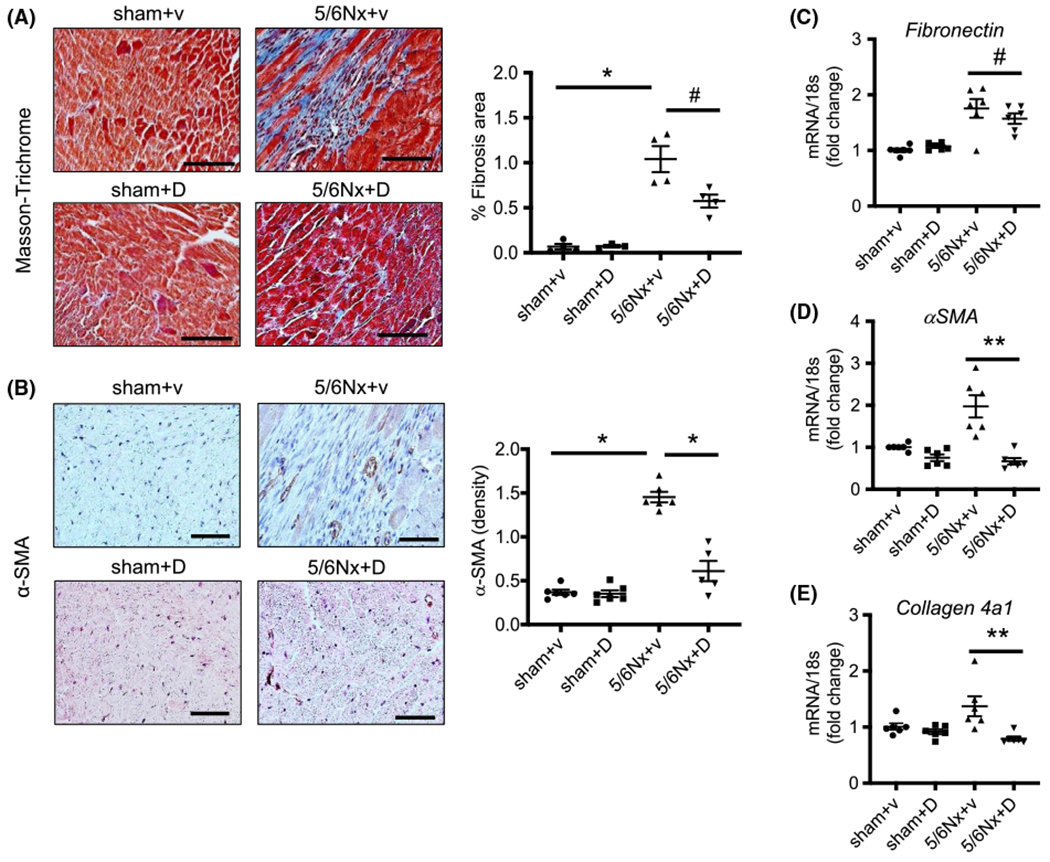
FIGURE 4.

Inhibition of UT-A attenuated CKD-induced cardiac fibrosis. A, Masson-Trichrome staining was performed in mouse heart tissues. Pictures were observed at ×200 magnification, scale bar is 100 μm. Blue color indicated fibrosis. The right point graph shows the percentage of fibrosis area per entire area as calculated using the Olympus CellSens imaging software (N = 4). B, Immunohistochemistry staining for α-SMA in mouse heart tissue with ×400 magnification, scale bar is 50 μm. The right point graph shows that the percentage of α-SMA area per entire area was calculated by Olympus CellSens imaging software (N = 4). C-E, Quantitative mRNA expression of fibronectin, α-SMA, and collagen 4a1 in mouse hearts performed by real-time PCR. Individual gene expression was calculated by ΔΔcq and standardized by housekeeping gene 18s. All data: mean ± SEM (N = 6). *P < .0001, **P < .005, #P < .05 by one-way ANOVA
