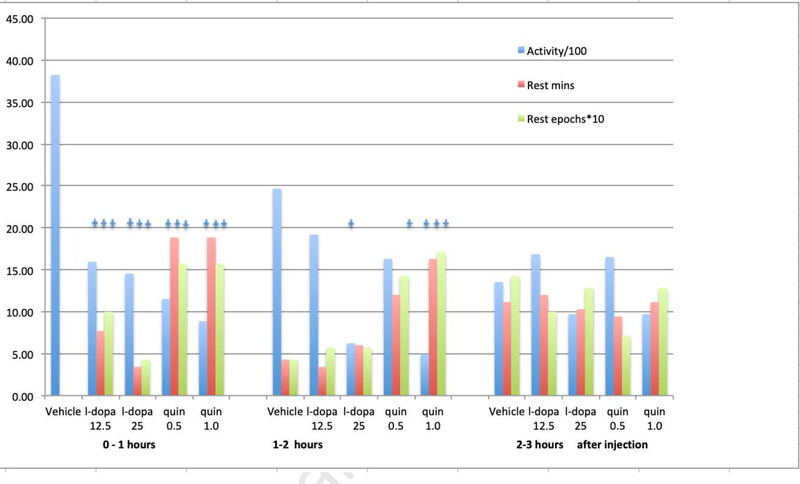
Figure 3:
RLS circadian phenotype behavior for each treatment condition and each of the 3 hours after treatment – ending at onset of the inactive (light) period. (n=7 Iron deprived BxD40f)
The stars over the bars indicate statistically significant differences (p<0.05) compared to vehicle (saline). The same 7 mice (BXD40f) after post-weaning dietary iron deprivation received each of the five treatments in the same order but with rotating starting points in the order. There was one day between each treatment.

