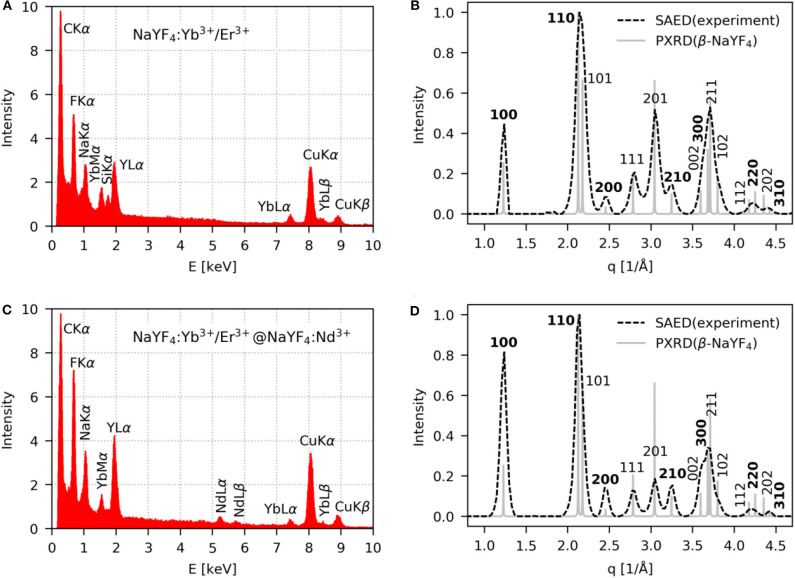
Figure 2.
(A,C) TEM/EDX and (B,D) TEM/SAED analysis of (A,B) NaYF4:Yb3+/Er3+ and (C,D) NaYF4:Yb3+/Er3+@NaYF4:Nd3+(0.5 mmol) nanoparticles. Experimental TEM/SAED diffractograms (dashed lines) were compared with theoretically calculated PXRD diffractograms for the hexagonal phase of β-NaYF4 (full lines).

