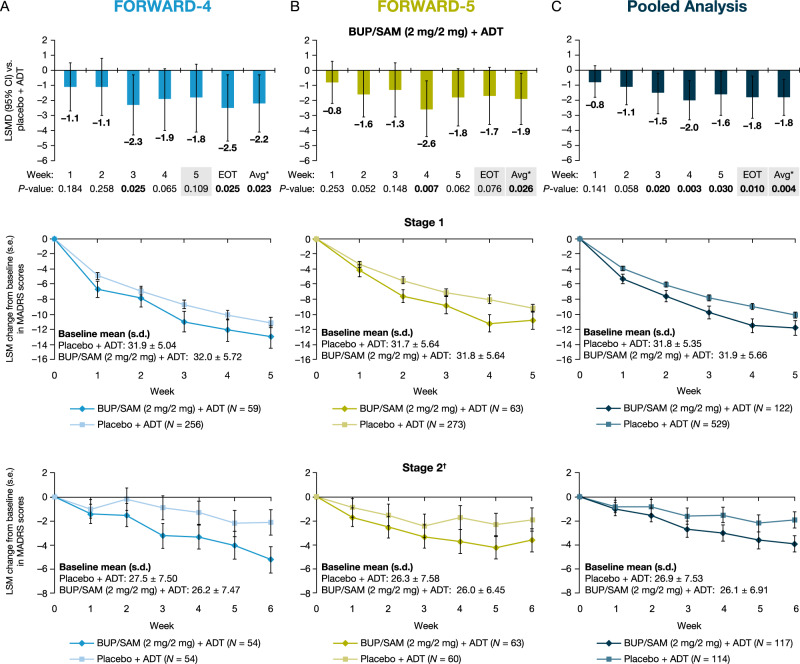
Fig. 2.
BUP/SAM (2 mg/2 mg) + ADT LSMD from placebo + ADT in the combined-stage change from baseline in MADRS-10 scores (first row) and LSM change in MADRS-10 scores for BUP/SAM (2 mg/2 mg) + ADT and placebo + ADT by week and stage (rows 2 and 3) in A FORWARD-4, B FORWARD-5, and C a pooled analysis. Shading indicates primary endpoints for each study. Error bars represent 95% CI or s.e. as indicated on the y-axis. *Avg: average change from baseline to week 3 through EOT. †Change from stage 2 baseline. ADT antidepressant therapy; BUP buprenorphine; CI confidence interval; EOT end-of-treatment; LSM least squares mean; LSMD least squares mean difference; MADRS Montgomery–Åsberg Depression Rating Scale; SAM samidorphan; s.d. standard deviation; s.e. standard error

