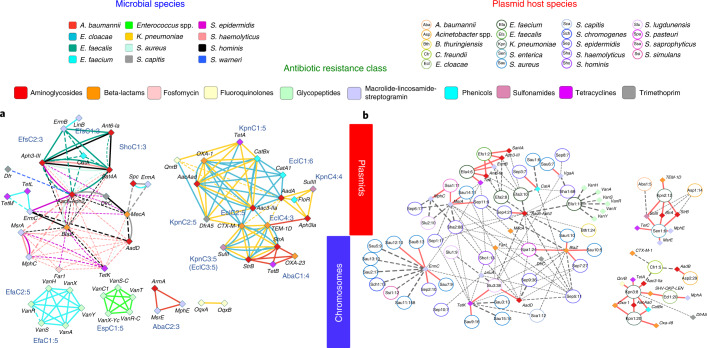
Fig. 4. Species distribution and genomic proximity of drug resistance genes in the hospital-environment microbiome.
Genomic proximity network and clustering of ARGs based on 2,347 microbial genomes and 5,910 closed plasmid sequences obtained from the hospital environment. a, Multigraph of genomic proximity between ARGs. Colored edges indicate gene pairs found <10 kb apart in the genomes for a species (excluding plasmids). Line widths indicate the frequency of occurrence of gene pairs (normalized by count for the rarer gene), and frequencies >80% are marked with solid lines. Solid-line cliques in each species were used to define cassettes and assign names (Supplementary Data 5), and the number after the colon indicates clique size. Genes are colored according to their respective antibiotic classes. b, Circles represent different plasmid clusters (95% identity), and their corresponding ARGs are connected by edges and indicated by diamonds. Plasmid nodes were labeled based on a three-letter short form for the host species and assigned a number (for example, Kpn1 for a K. pneumoniae plasmid); the number after the colon indicates how many representatives of the plasmid family were observed in the database. Edges are weighted by the frequency at which a gene is present in a plasmid, and frequencies >80% are indicated with red solid lines. Genes and backbones are color coded according to their respective ARG classes and inferred host species for ease of reference.

