
Fig. 2.
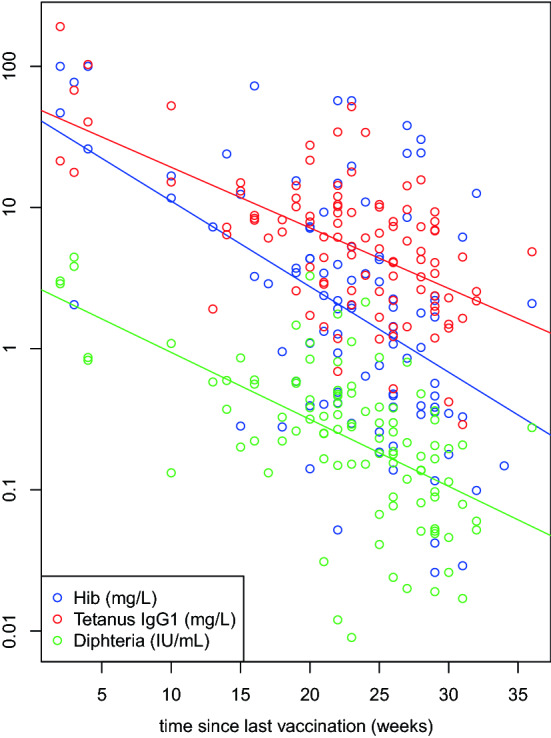
Scatter plot of levels of vaccine antibodies as measured in plasma for Hib (n = 98), tetanus IgG1 (n = 100) and diphtheria (n = 100), in relation to the time since the last vaccination in children with at least two vaccinations
Official websites use .gov
A
.gov website belongs to an official
government organization in the United States.
Secure .gov websites use HTTPS
A lock (
) or https:// means you've safely
connected to the .gov website. Share sensitive
information only on official, secure websites.
Scatter plot of levels of vaccine antibodies as measured in plasma for Hib (n = 98), tetanus IgG1 (n = 100) and diphtheria (n = 100), in relation to the time since the last vaccination in children with at least two vaccinations