Fig. 4.
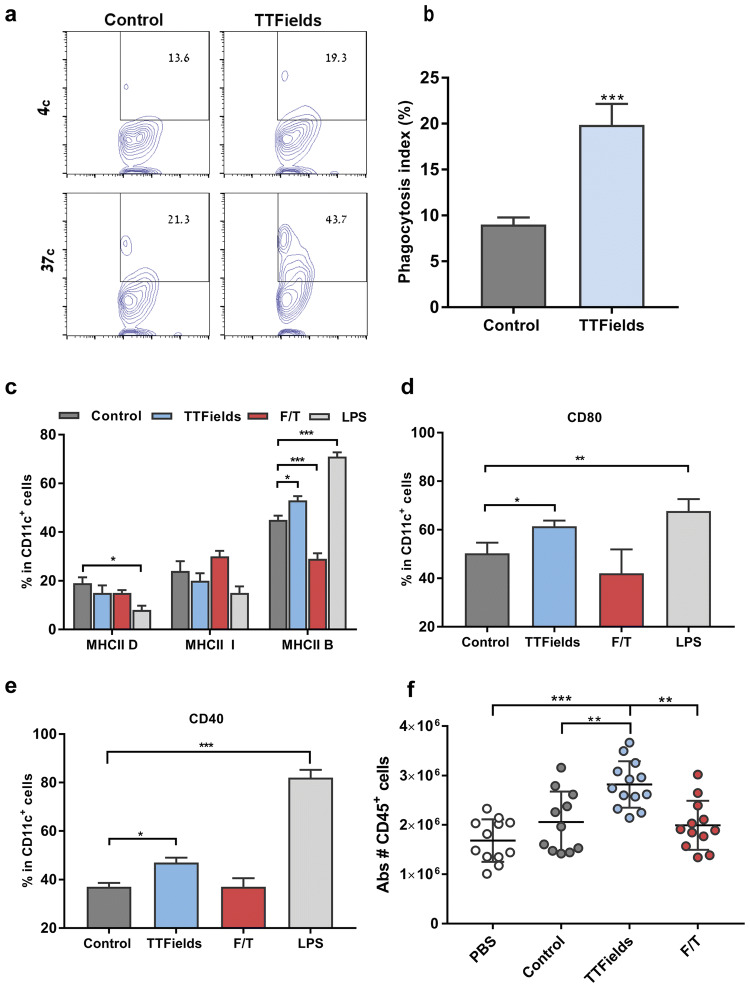
Culture of TTFields-treated cancer cell suspension induces maturation of bone marrow-derived dendritic cells. a, b Co-culture of cell tracker deep red labeled, untreated, or TTFields-treated LLC-1 cells and BMDCs. CD11c+Deep Red+events were quantified using flow cytometry. a Representative flow cytometry plot and b quantification of phagocytosis index. N = 3, and data are presented as mean ± SD. c–e Co-culture of untreated, TTFields-treated, F/T-treated, or LPS-treated LLC-1 cells and BMDCs. BMDCs maturation phenotype was assessed using flow cytometry. Quantification of activation markers: c MHC II (D-dim, I-intermediate, and B-bright expression), d CD80, and e CD40. N ≥ 4, and data are presented as mean ± SEM. f LLC-1 cells were either left untreated or treated with TTFields- (48 h), or F/T-treated cells and were intraperitoneally injected into wild-type C57/Bl6 mice. Equal volumes of PBS were injected in mice as negative controls. Peritoneal exudate cells were collected 48 h later and analyzed using flow cytometry. Graphs represent the number of CD45 + cells in peritoneal exudate cells. N = 2, bars indicate mean of two pooled independent experiments with 5–7 mice per group. Each circle represents one mouse. P values were determined using unpaired two-tailed t test for (b) or one-way ANOVA followed by Dunnett’s post-test (c–f). *P < 0.05; **P < 0.01; ***P < 0.001

