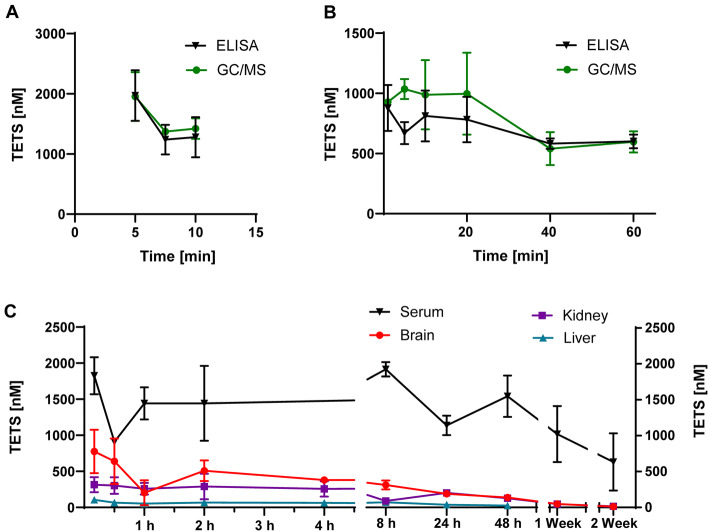
Fig. 3.
TETS persist in vivo. a Pilot experiment comparing the sensitivity of the TETS ELISA to GC/MS following i.p. administration of 0.2 m/kg TETS to mice (n = 3). Shown are serum concentration as mean ± SD. b TETS serum concentration following i.v. bolus administration of 0.05 mg/kg TETS (n = 5). c Long-term pharmacokinetic experiment showing TETS concentrations in serum, brain, kidney and liver over a time course of 2 weeks (n = 3 mice per time point). Shown are total concentrations as mean ± SD

