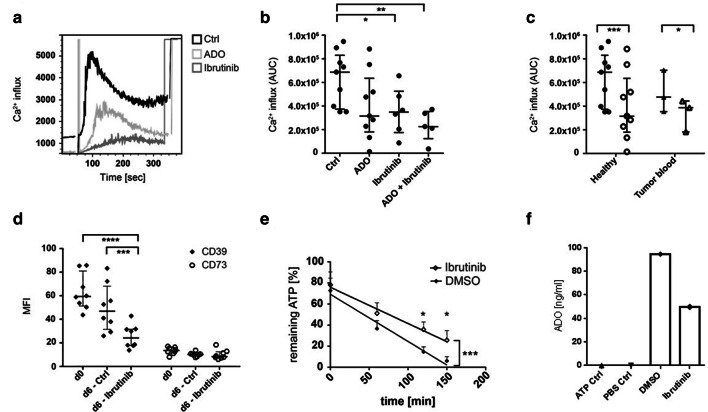
Fig. 3.
Calcium influx and B cell responses to treatment with the BTK inhibitor ibrutinib. a Isolated B cells were treated overnight with ADO and/or ibrutinib, stained with Indo-1 and stimulated with anti-µ-F(ab’)2 for direct Ca2+ measurement. The overlay plot of the kinetics shows control B cells in black, ADO-treated B cells in light gray and ibrutinib-treated B cells in dark gray of one representative experiment. The results were calculated by the following ratio: intensity indo-1 violet/indo-1 blue. b The Ca2+ influx was significantly reduced by ibrutinib and by the combination of ibrutinib and ADO. AUC = area under the curve as mean ± SD analyzed with one-way ANOVA; median with interquartile range; n = 9. c The data suggest that peripheral B cells of tumor patients (n = 3) show significantly decreased Ca2+ influx after ADO treatment as compared to B cells of healthy donors (n = 9) analyzed with a two-way ANOVA; median with interquartile range. d The MFI of CD39 and CD73 on B cells was measured by FACS before and after treatment with ibrutinib or DMSO as a control. Ibrutinib induced a significant decrease in CD39 expression. Data were analyzed with a two-way ANOVA; median with interquartile range. e B cells were stimulated with CD40L, IL-4 and hemagglutinin and treated with ibrutinib for 6 days. Remaining ATP as measured by luminescence was significantly higher in ibrutinib-treated B cells as compared to control B cells (n = 7). Analyzed by two-way ANOVA; (*) p < 0.05; (**) p < 0.01; (***) p < 0.001; (****) p < 0.0001. f Adenosine concentrations measured by mass spectrometry for B cells of one donor stimulated for 6 days with CD40L, IL-4 and hemagglutinin and treated with ibrutinib. ATP was added at a concentration of 20uM

