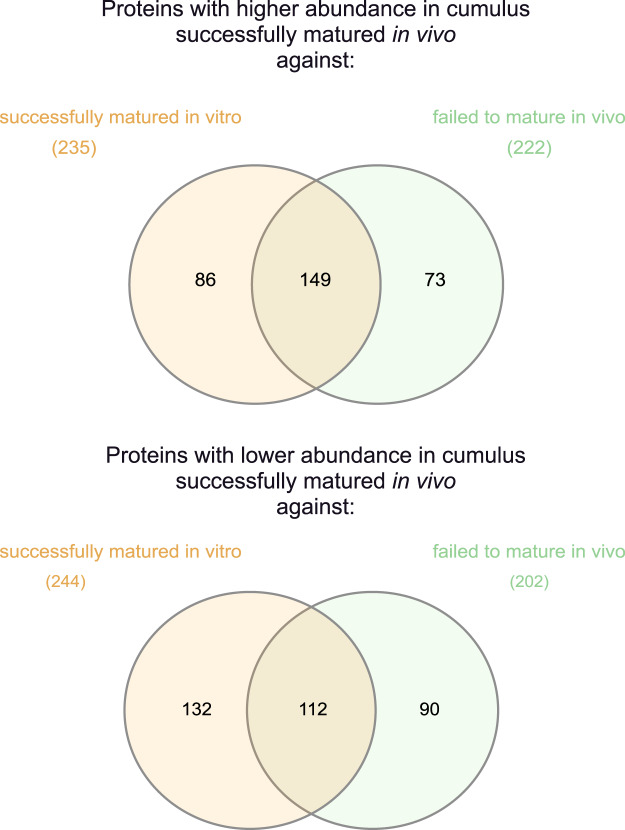
Figure 4.
Venn diagrams for the comparison of significantly different results (fold change >2 along with p ≤ 0.05) between the “successfully matured in vivo” group against the groups “failed to mature in vivo” and “successfully matured in vitro”. The upper diagram shows the proteins with higher abundance, the lower diagram the proteins with lower abundance in the “successfully matured in vivo” group. The left side (orange) shows the comparison against the “successfully matured in vitro” group, the right side (green) shows the comparison against the “failed to mature in vivo” group. In total, 381 proteins with significantly different expression were not shared between these two group comparisons, whereas 261 were shared.

