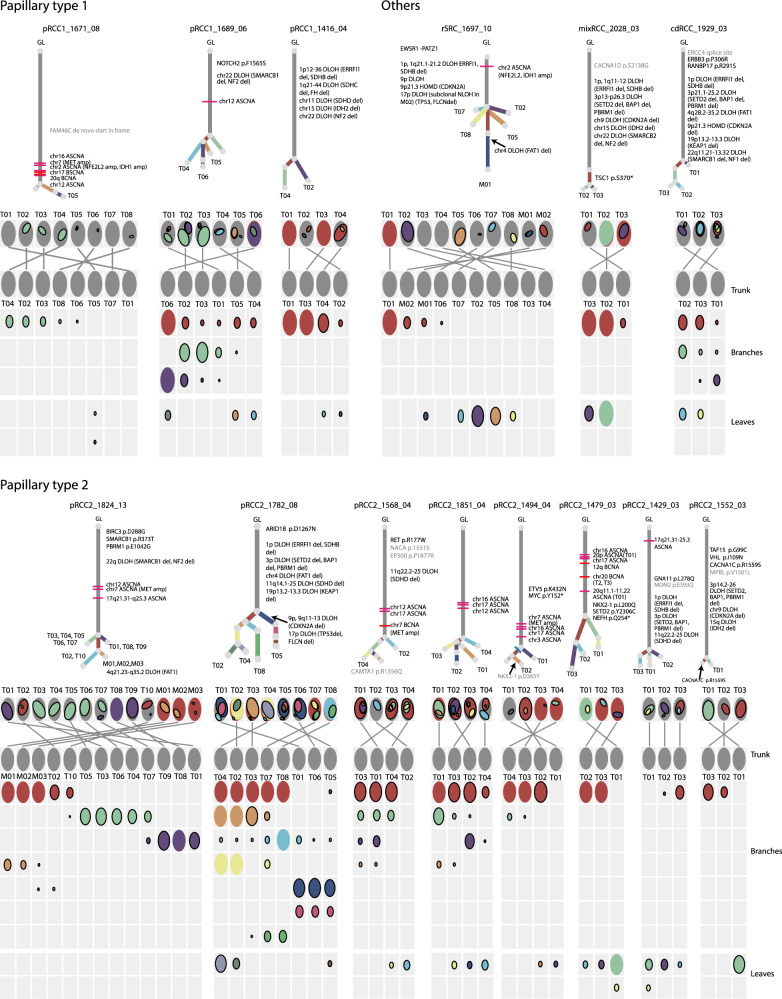
Fig. 2. Phylogenetic trees and oval plots for tumors with three or more samples.
Phylogenetic trees: the trees show the evolutionary relationships between subclones (annotated by different colors). Trunk and branch lengths are proportional to the number of substitutions in each clone cluster. Driver SNV and recurrent somatic copy number alterations are annotated on the trees. Tumor regions containing sample-specific subclones are indicated on the tree leaves. Oval plots: In the top rows the ovals are ordered based on the physical sampling of the tumor regions. Ovals are nested if required by the pigeonhole principle. The first row of the plot with nested ovals is linked by lines to the ovals ordered by the phylogenetic analysis, indicating intermixing of subclones spread across 2 or more tumor regions. In the matrix, each main clone (without solid border) and subclone (with solid border) is represented as a color-coded oval. The size of the ovals is proportional to the CCF of the corresponding subclones. Each column represents a sample. Oval plots are separated into three parts: trunk (top, CCF = 1 in all samples), branch (middle present in >1 sample but not with CCF = 1 in all samples), and leaf (bottom, specific to a single sample). GL germline, amp amplification, DLOH hemizygous deletion loss of heterozygosity, HET diploid heterozygous, NLOH copy neutral loss of heterozygosity, HOMD homozygous deletion, ASCNA allele-specific copy number amplification, BCNA balanced copy number amplification.

