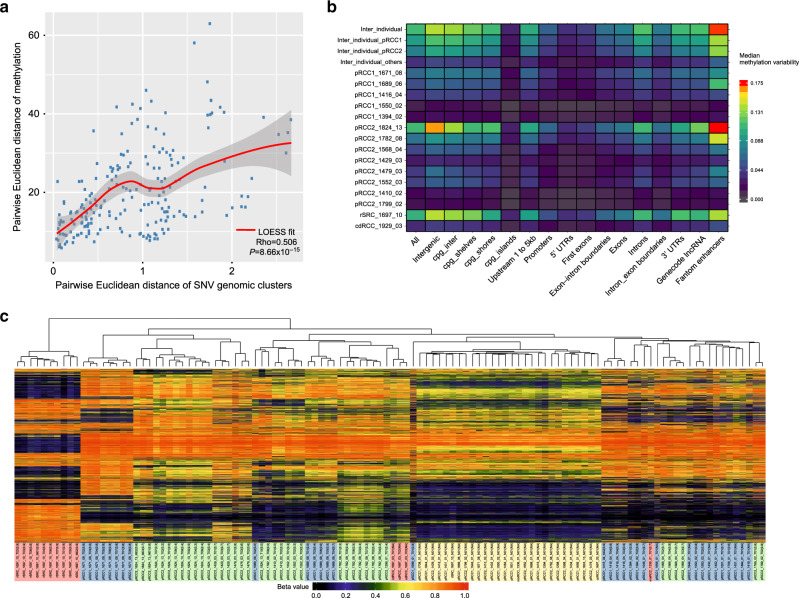
Fig. 5. Intratumor heterogeneity (ITH) of methylation profiles.
a Scatter plots of pairwise distance between methylation and single nucleotide variant clusters. LOESS (Locally Weighted Scatterplot Smoothing) fitted curve is shown in red line with 95% confident interval in gray shaded area. Spearman’s rank correlation rho is shown on the bottom right. For the two-sided test of rho = 0, the test statistic S is 719790 based on the algorithm AS 89. The exact P value is 8.66 × 10⁻¹⁵. b Methylation ITH on genomic regions for each sample and tumor subtype. c Unsupervised hierarchical clustering of methylation profiles measured by the methylation level as beta value for the top 1% most variable methylation probes. Sample IDs are followed by the purity estimated by SCNAs or SNV VAF in parentheses. The background colors of the sample IDs represent different histological subtypes and tumor or normal tissue samples.

