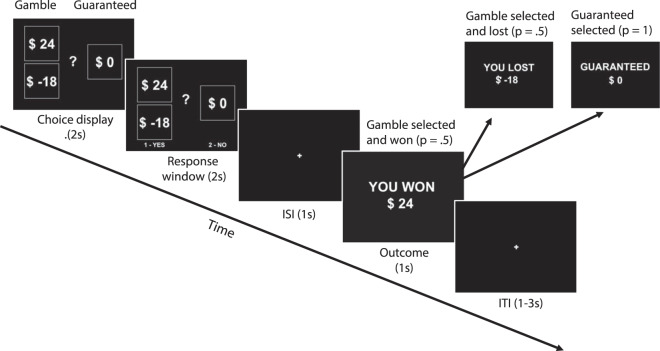
Figure 1.
Risky monetary decision-making task structure. Across all four studies2–5 compiled for the current analysis, participants made a series of choices between risky and safe options. Every trial featured a risky option with two possible outcomes, each received with 50% probability if that option was selected, and a safe, or guaranteed option received with 100% probability if selected. All choices were followed by outcomes prior to the next choice appearing on the screen. See Supplementary Material and Table S2 for details on the minor variations across studies.

