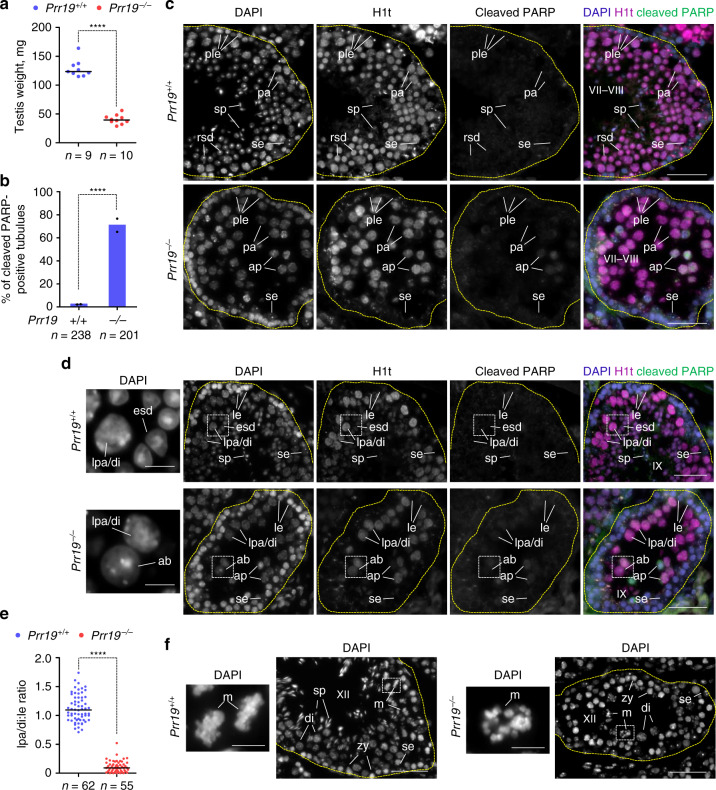
Fig. 3. Depletion of late prophase spermatocytes in PRR19-deficient males.
a The average single testis weights in adult wild-type and PRR19-deficient mice. The number of analysed animals (n) and medians (bars, wild-type, 123.5 mg, Prr19−/−, 39.55 mg) are indicated. Mann–Whitney U test calculated P = 2.17E-05. b Quantification of seminiferous tubules that contain cleaved PARP-positive apoptotic spermatocytes in the pachytene/diplotene layer. Graph shows datapoints and weighted averages of percentages of seminiferous tubules. n = number of tubules counted in two independent experiments. An analysis of deviance using the likelihood-ratio test based on the chi-squared distribution was used to calculate if the proportion of apoptotic seminiferous tubules is significantly altered by the loss of PRR19, P = 2.2E-16 (****). c, d, f Images show DNA staining by DAPI and (c, d) immunostaining of histone H1t (staging marker of seminiferous tubules) and cleaved PARP (marker of apoptosis) in sections of testes from adult wild-type and Prr19−/− mice. Seminiferous tubules in epithelial cycle stages VII–VIII (c), IX (d) and XII (f) are shown; see ‘Methods' for staging. Sertoli cells (se), preleptotene (ple), leptotene (le), zygotene (zy), pachytene (pa), late pachytene (lpa), diplotene (di) and metaphase (m) spermatocytes, round (rsd) and elongating (esd) spermatids, sperm (sp), H1t-positive cells with abnormal nucleus morphology (ab) and apoptotic spermatocytes (ap) are marked. Outlines of tubules (yellow dashed line) and tubule stages are indicated. Enlarged insets show abnormal H1t-positive cells in Prr19−/− and corresponding spermatids in wild-type seminiferous tubules (side panel, d), or misaligned metaphase chromosomes in Prr19−/− and orderly metaphase plates in wild-type seminiferous tubules (f). (c, d, f) Bars, 50 µm; enlarged insets (d, f) 10 µm. e The ratios of late pachytene-diplotene to leptotene spermatocyte numbers (lpa/di:le) were quantified in stage IX seminiferous tubules in testis sections from adult wild-type and PRR19-deficient mice. n = numbers of analysed tubules from six (wild-type) or five (Prr19−/−) animals; medians (bars, wild-type, 1.09, Prr19−/−, 0.09) were compared using Mann–Whitney U test, P < 2.2E-16 (****). Source data are provided as a Source Data file.

