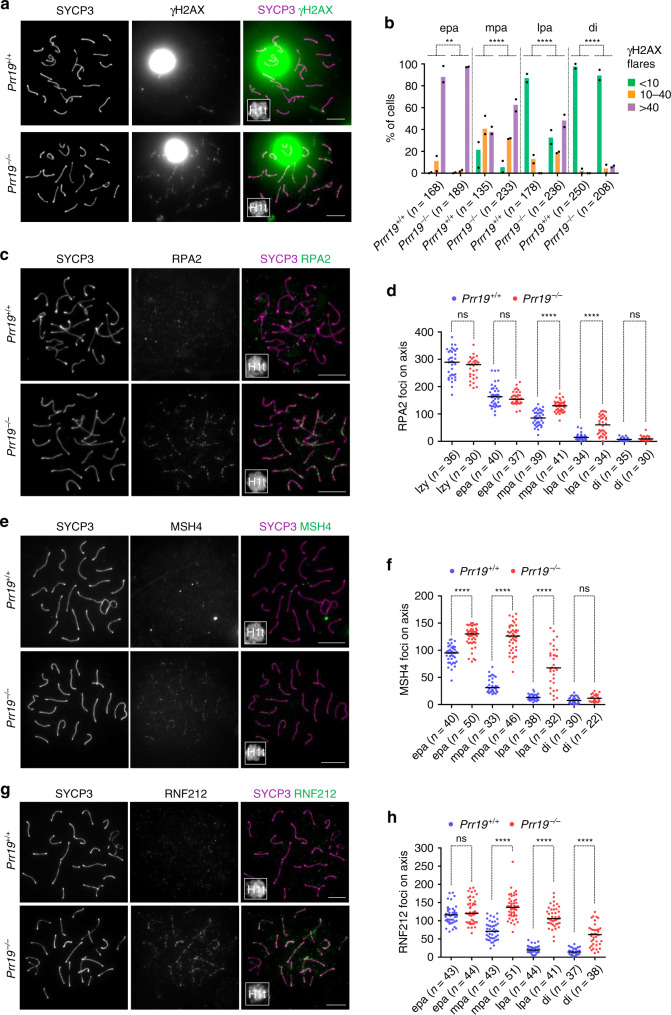
Fig. 5. DSB repair is delayed in PRR19-deficient cells.
a, c, e, g Indicated proteins were detected by immunofluorescence in nuclear surface-spread spermatocytes; late pachytene cells are shown. Miniaturised H1t signal of the corresponding cell is shown in the bottom left corner of overlay images. Saturated γH2AX signal (a) corresponds to the silenced chromatin of sex chromosomes, which is a chromatin compartment where histone γH2AX hyperaccumulates in pachytene and diplotene stages. Bars, 10 µm. b Quantification of γH2AX flare numbers in early (epa), mid (mpa), late pachytene (lpa) and diplotene (di) spermatocytes. Three categories were distinguished, (green) spermatocytes with less than 10 flares, (orange) between 10 and 40 flares and (lilac) more than 40 flares of γH2AX on autosomes. Graph shows datapoints and weighted averages of percentages of spermatocytes in the three categories, n = numbers of analysed cells from two animals. An analysis of deviance using the likelihood-ratio test based on the chi-squared distribution was used to calculate if loss of PRR19 significantly alters the proportions of cells with distinct numbers of γH2AX flares in epa, P = 0.00129, mpa, P = 2.48E-07, lpa, P = 2.20E-16, di, P = 1.23E-05. d, f, h Quantification of (d) RPA, (f) MSH4 and (h) RNF212 axis-associated focus numbers in late zygotene (lzy, RPA only), early (epa), mid (mpa), late pachytene (lpa) and diplotene (di) spermatocytes. n = numbers of analysed cells from two animals. Median focus numbers (bars) were compared with Mann–Whitney U test, and are as follows in wild-type and Prr19−/−: (d, RPA) lzy, 289.5 and 280.5 (P = 0.1492), epa, 163 and 154 (P = 0.6426), mpa, 85.5 and 130 (P = 7.12E-10), lpa, 14.5 and 60.5 (P = 2.32E-07), di, 7 and 9 (P = 0.1148), (f, MSH4) epa, 95 and 130 (P = 3.13E-11), mpa, 31 and 126 (P = 4.99E-14), lpa, 13 and 67.5 (P = 2.21E-10), di, 7.5 and 11.5 (P = 0.05838), (h, RNF212) epa, 116 and 120.5 (P = 0.1783), mpa, 71 and 137 (P = 2.18E-14), lpa, 19.5 and 106 (P = 2.26E-15), di, 14 and 62 (P = 6.12E-11), respectively. b, d, f, h ns, **, *** and **** indicate no significance (P > 0.05), 0.01 > P > 0.001, 0.001 > P > 0.0001 and P < 0.0001, respectively. Source data are provided as a Source Data file.

