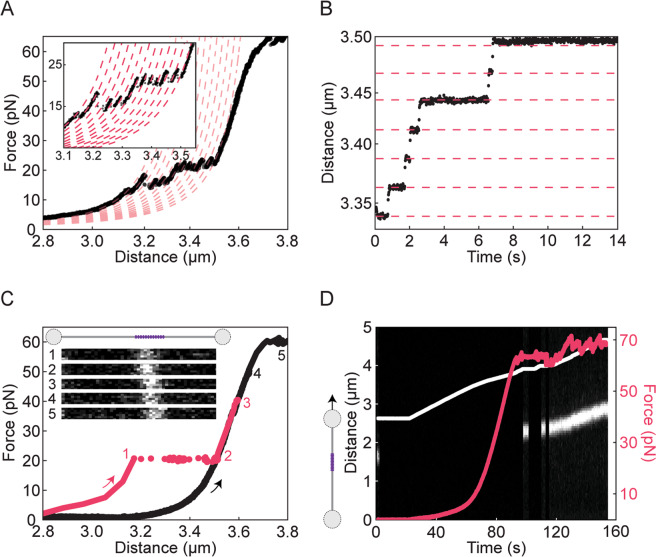
Figure 4.
Characterisation of a 12-nucleosome array using dual-trap optical tweezers in combination with confocal fluorescence microscopy. (A) A sample force-distance curve of a 12-nucleosome array (derived from a linearised 12 × 601-pKYB1 vector with 25 base pair linkers) recorded using a stretching speed of 20 nm s–1. The unwrapping of the inner turn of each of the twelve nucleosomes is identified by the characteristic saw-tooth-like pattern ~20 pN. The expected shift in DNA contour length after each inner turn unwrapping event (~25 nm) is identified by fitting the force-distance data to a series of curves based on the Worm-Like Chain model (dashed red lines). (B) DNA extension for the 12-nucleosome array at a constant force of 20 pN as a function of time, showing abrupt step changes of ~25 nm (highlighted by the dashed red lines). These steps correspond to the ~80 base pairs that are released following unwrapping of the inner turn of each nucleosome. (C) Sample force-distance curve of the 12-nucleosome array after pre-incubation with Alexa-647-labelled histone H3 antibody. Corresponding confocal fluorescence images (inset) were recorded: (1) immediately after increasing the tension to 20 pN; (2) after 60 seconds at 20 pN; and (3) after 60 seconds at 40 pN. The corresponding change in DNA extension is shown in red. Images 4–5 were recorded at 50 pN and 60 pN, respectively, after 60 seconds at each force. Note that prior to recording images 4 and 5, the DNA molecule was retracted and re-extended (highlighted by the black force-distance curve). (D) Sample kymograph of histone H3 antibody fluorescence associated with the 12 × 601-pKYB1 construct as a function of time as the construct is stretched at a speed of 20 nm s−1. The corresponding force and extension are overlaid on the kymograph in red and white lines, respectively. Note that in order to ensure all nucleosomes were first unwrapped, the construct was stretched from 0 to 60 pN prior to this measurement. Therefore, the kymograph shown here represents a ‘re-stretch’ following nucleosome unwrapping. In order to minimise bleaching, the fluorescence excitation source was strobed, such that excitation was permitted only at low forces (<1 pN) and at high forces ≥ 60 pN.

