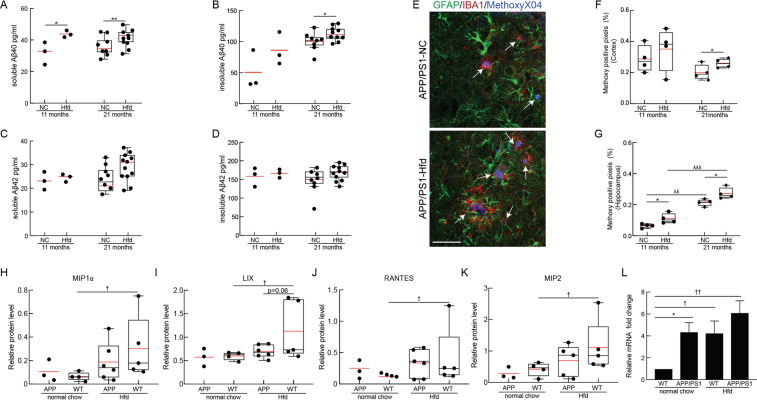
Figure 2.
Immunohistochemical and molecular analysis of brain tissue of APP/PS1 and WT mice fed a Hfd or normal chow. PBS-soluble fraction of Aß40 (A) and Aß42 (C) monomeric species and formic acid-soluble fraction of Aß40 (B) and Aß42 (D) monomeric species, measured using ELISA from the brains of APP/PS1 mice on Hfd (started at 4 months of age) or normal chow for mice at 11 and 21 months of age. Animal numbers for all measurements — 11 months: APP/PS1-Hfd: n = 3; APP/PS1-NC: n = 3; 21 months: APP/PS1-Hfd: n = 10; APP/PS1-NC: n = 9); *p < 0.05 and **p < 0.01; Student’s t-test. (E) Representative confocal images of cortical immunostained sections from 21-month old APP/PS1-NC mice on normal chow (top) or Hfd (bottom), stained with MethoxyX04 for amyloid plaques (blue, plaques indicated with white arrows), anti-IBA1 for microglia (red), and anti-GFAP for astrocytes (green). Scale bar = 50 µm. Percentage of pixels above threshold for Methoxy-X04 in the cortex (F) and hippocampus (G) for 11 and 21 month old APP/PS1 mice on normal chow and Hfd. Animal numbers for all measurements — 11 months: APP/PS1-NC: n = 3; WT-NC: n = 3; APP/PS1-Hfd: n = 3; WT-Hfd: n = 4; 21 months: APP/PS1-NC: n = 4; WT-NC: n = 4; APP/PS1-Hfd: n = 4; WT-Hfd: n = 3; *p < 0.05 between genotypes (APP/PS1 vs. WT); λp < 0.05, λλp < 0.01, and λλλp < 0.001 between animal ages; Student’s t-test. Relative protein levels of (H) Macrophage inflammatory protein 1 alpha (MIP1α) (I) CXCL5 (LIX) (J) CCL5 (RANTES) and (K) CXCL2 (MIP2) for APP/PS1 and WT mice on normal chow or Hfd at 21 months of age. Animal numbers for all measurements — APP/PS1-NC: n = 3; WT-NC: n = 4; APP/PS1-Hfd: n = 5; WT-Hfd: n = 5; †p < 0.05 between diets (Hfd vs. NC); one-way ANOVA with post-hoc pair-wise comparisons using Dunn’s multiple comparison correction. (L) Expression of endogenous murine APP mRNA from brain tissue of APP/PS1 and WT mice on a Hfd or normal chow at 21 months of age, normalized to GAPDH mRNA levels. Animal numbers for all measurements — APP/PS1-NC: n = 4; WT-NC: n = 3; APP/PS1-Hfd: n = 4; WT-Hfd: n = 4); *p < 0.05 between genotypes (APP/PS1 vs. WT); †p < 0.05, ††p < 0.01 between diets (Hfd vs. NC); Student’s t-test.

