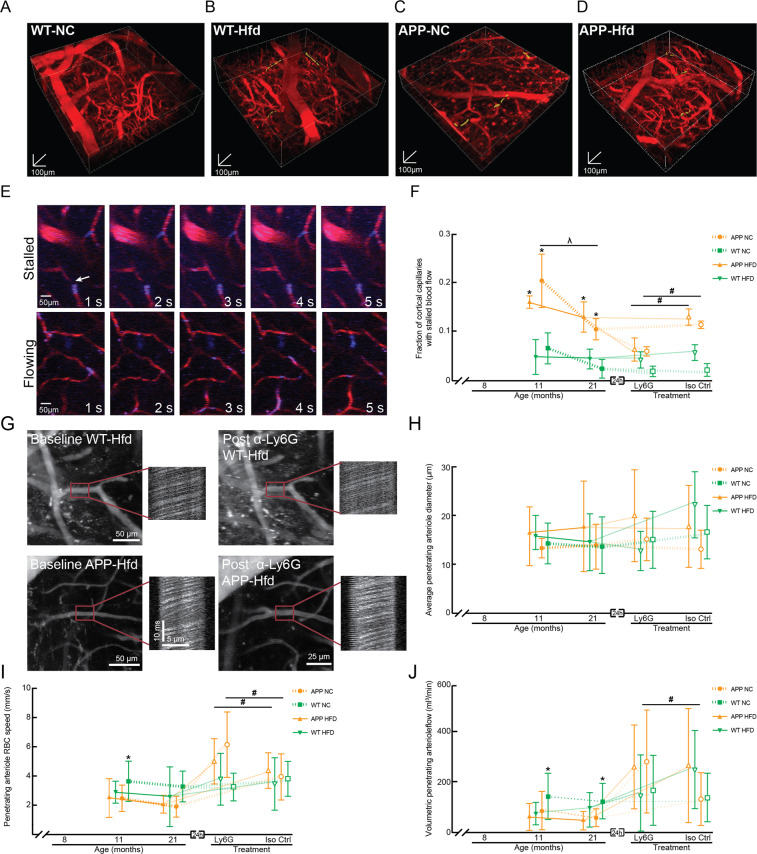
Figure 6.
Incidence of non-flowing capillaries and ateriole blood flow speeds in APP/PS1 and WT animals on a Hfd or normal chow. (A–D) Renderings of 2PEF image stacks of cortical vasculature (red; Texas Red dextran) with stalled capillaries indicated by yellow highlights for APP/PS1 and WT mice on Hfd or NC. 3D scale bars are 100 µm. (E) Sequence of 2PEF images used to score individual capillaries as flowing or stalled based on the motion of unlabeled blood cells (dark patches in vessel lumen) within the fluorescently labeled blood plasma (red). Rhodamine 6 G (blue) labels leukocytes and platelets. Scale bar represents 50 µm. (F) Groupwise averages of the fraction of cortical capillaries with stalled blood flow at baseline for mice at 11 and 21 months of age and taken 24 hours after α-Ly6G or Iso-Ctr antibody administration at the 21 month time point (4 mg/kg animal weight, intraperitoneal). Animal numbers for all measurements — 11 and 21 months: APP/PS1-NC: n = 3; WT-NC: n = 3; APP/PS1-Hfd: n = 3; WT-Hfd: n = 3; 21 months: APP/PS1-NC α-Ly6G: n = 3; APP/PS1-NC Iso-Ctr n = 3; WT-NC α-Ly6G: 3; WT-NC Iso-Ctr: 3; APP/PS1-Hfd α-Ly6G: n = 3; APP/PS1-Hfd Iso-Ctr: n = 3; WT-Hfd α-Ly6G: n = 3; WT-Hfd Iso-Ctr: n = 3. *p < 0.05 between genotypes (APP/PS1 vs. WT); #p < 0.05 between treatment groups (Ly6G vs. Iso-Ctr); Kruskal-Wallis one-way ANOVA with post-hoc pair-wise comparisons using Dunn’s multiple comparison test. (G) Representative 2PEF images and line scan data from PA + 1 before and after α-Ly6G injection from WT-Hfd (upper panels) and APP-Hfd (lower panels). Scale bar represents 50 µm. Groupwise averages of average penetrating arteriole diameter (H), penetrating arteriole RBC speed (I), and volumetric penetrating arteriole flow (J) taken at baseline for mice at 11 and 21 months of age, and taken 24 hrs after α-Ly6G or Iso-Ctr antibody administration at the 21 month time point (4 mg/kg animal weight, intraperitoneal). PA + 1 numbers for all measurements — 11 and 21 months: APP/PS1-NC: n = 26; WT-NC: n = 37; APP/PS1-Hfd: n = 27; WT-Hfd: n = 26; 21 months: APP/PS1-NC α-Ly6G: n = 21; APP/PS1-NC Iso-Ctr n = 12; WT-NC α-Ly6G: 13; WT-NC Iso-Ctr:9; APP/PS1-Hfd α-Ly6G: n = 18; APP/PS1-Hfd Iso-Ctr: n = 24; WT-Hfd α-Ly6G: n = 15; WT-Hfd Iso-Ctr: n = 11. *p < 0.05 between genotypes (APP/PS1 vs. WT); #p < 0.05 between treatment groups (Ly6G vs. Iso-Ctr); #λp < 0.05 between animal ages; Kruskal-Wallis one-way ANOVA with post-hoc pair-wise comparisons using Dunn’s multiple comparison test.

