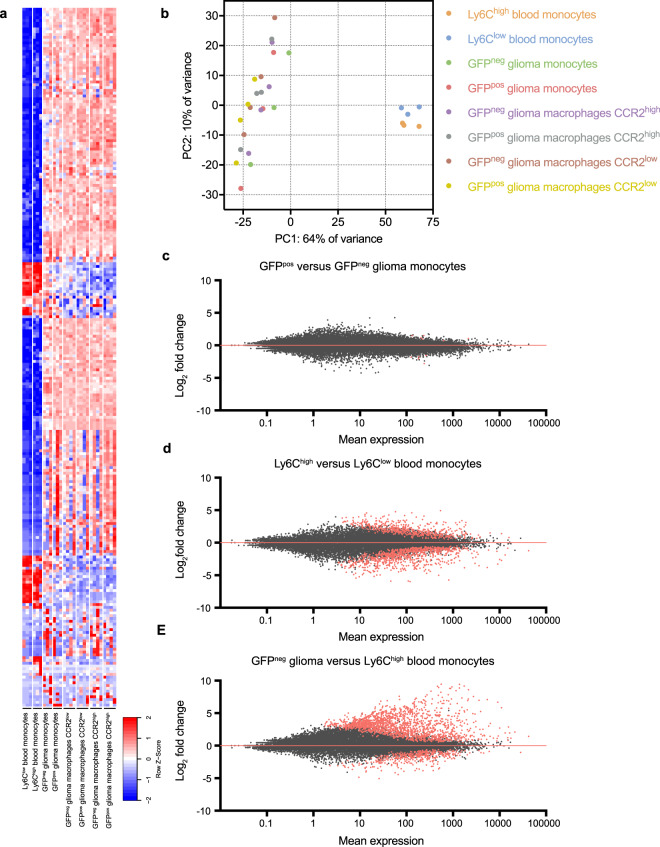
Figure 2.
Global analyses of gene expression. (a) Top 250 most differentially expressed genes among 8 cell subtypes isolated from blood and brain. (b) PCA plot illustrates difference in principle components between brain and blood samples. (c) MA plot reveals the number of genes with a significant change in expression in comparison between GFPpos and GFPneg brain monocytes. (d) Significantly differentiated gene expression shown in MA plot between blood-derived classical infiltrating monocytes (Ly6Chigh) and patrolling monocytes (Ly6Clow). (e) Significantly differentiated gene expression shown in MA plot between blood-derived monocytes and glioma monocytes.

