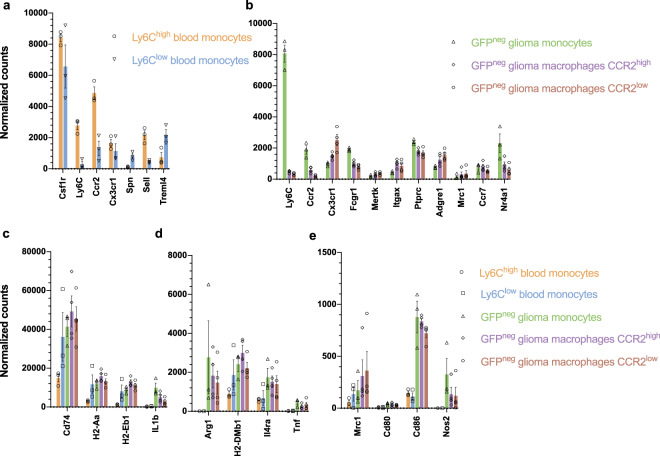
Figure 3.
Different cell populations show expression of specific markers. (a) Gene expression of markers specific to inflammatory Ly6Chigh (Cx3cr1mid Ccr2+ Cd62l+ Cd43low Treml4+) and patrolling Ly6clow (Cx3cr1high Ccr2- Cd62l- Cd43high Treml4-) monocytes (b) Normalized read counts of cell markers used to identify and differentiate monocytes from macrophages (CCR2high and CCR2low), including Ly6C, Ccr2, Cx3cr1, Fcgr1, Mertk, Itgax, Ptprc, Adgre1, Mrc1, Ccr7 and Nr4a1. (c) Expression of activation markers Cd74, H2-Aa, H2-Eb1, IL1b (d) Arg1, H2-DMb1, Il4ra, Tnf (E) Mrc1, Cd80, Cd86 and Nos2 shows that after infiltration into the glioma monocytes and macrophages are in an activated state. Data represents 3 independent experiments and are presented as the mean with SEM (error bars). Differential expression analysis with fold2change, SEM and adjusted p-values are listed in Supplementary Table S1.

