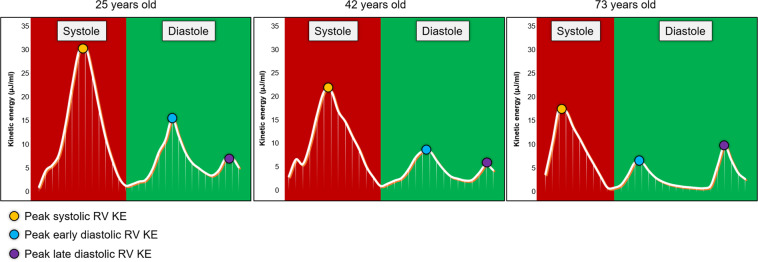
Figure 4.
Three line graphs, in participants aged 25, 42 and 73 years old, to demonstrate the three blood flow kinetic energy peaks during the cardiac cycle during diastole and systole. The yellow dot shows the systolic peak of the kinetic energy curve. The blue dot denotes the E-wave peak of the kinetic energy curve. The purple dot is on top of the A-wave peak of the kinetic energy curve. The systolic peak decreases as age increases. Regarding diastole, early tricuspid inflow blood flow kinetic energy sharply decreases, and there is no significant pattern to late tricuspid filling. At age 73 it can be seen that the time for diastole is much longer, this is a compensatory mechanism to allow more time for the ventricle to fill as the kinetic energy of the blood flow is not very high. The x-axis gives the time through the cardiac cycle. The y-axis shows the kinetic energy, in µJ/ml.

