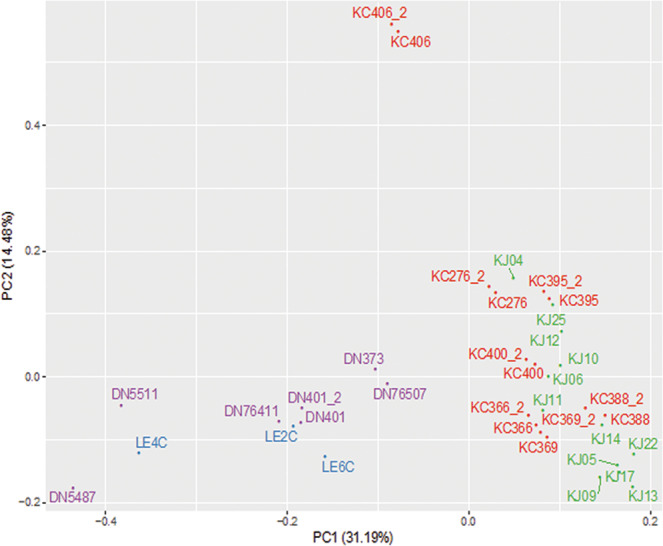
Figure 2.

Principal component analysis (PCA) of patient and donor samples. PCA was performed on 19 Keratoconus (7 KC and 12 KJ) and 10 control (7 DN and 3 LE) corneas using 10,652 genes with FPKM value ≥ 5 in at least one sample. Technical duplicates of 7 KC and 1 DN samples (KC*_2 and DN401_2) appear close together. The major separation along PC1 was between KCN and controls. KC and KJ samples cluster together along PC1. African American donor (DN) and KC patient samples are labeled purple and red, respectively; Caucasian donors (LE) are in blue and Middle Eastern patients (KJ) in green. Euclidean distance between samples in a pairwise comparison of samples in PC1 and PC2 is shown in Supplemental Table S3.
