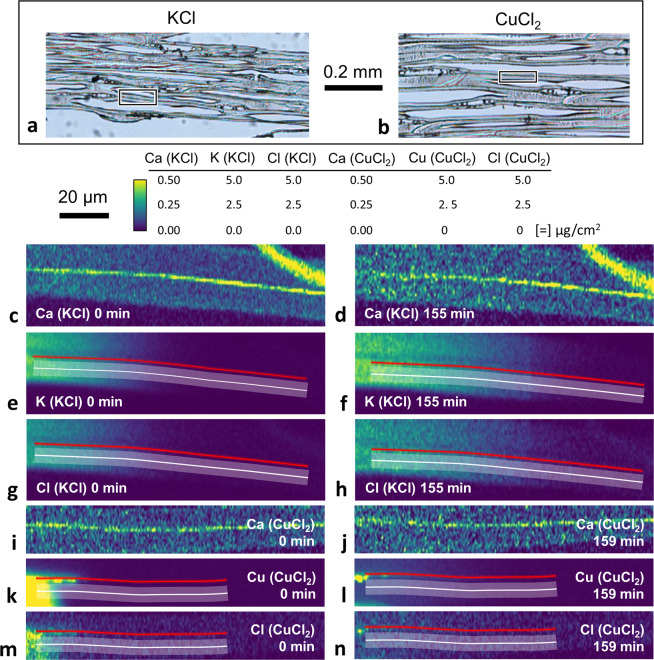
Figure 2.
Optical microscopy images of 2-μm-thick sections of loblolly pine used for (a) KCl or (b) CuCl2 diffusion experiments. The rectangles in (a,b) indicate the cell walls imaged with X-ray fluorescence microscopy (XFM). XFM intensity maps from the first and final images of time-lapse series in cell walls with (c–h) a locally applied KCl aqueous microdroplet and conditioned at 70% relative humidity (RH), or (i–n) a locally applied CuCl2 aqueous microdroplet and conditioned at 75% RH. The Ca maps are also included to help identify anatomical features in these longitudinal sections. In all Ca maps, the higher intensity line that stretches from left to right is the compound middle lamella (CML). The longitudinal wood orientation is parallel to the CML. The high intensity feature in the upper right-hand corner of the Ca KCl maps was a piece of debris lying on top of the section that did not interfere with the diffusion experiment. The lowest intensity regions in the Ca map were empty lumina. The material with intensities between the CML and lumina was identified as S2 secondary cell wall layer.

