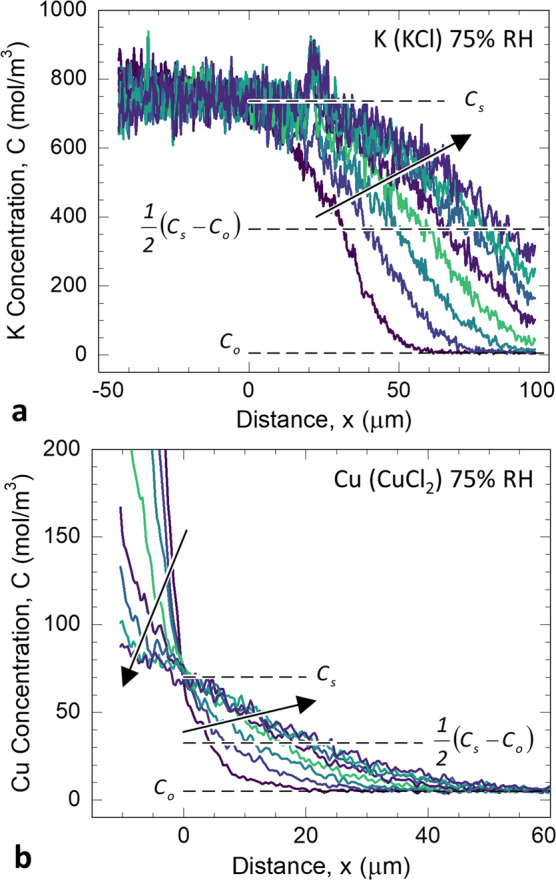
Figure 3.

Time-dependent cation concentration (C) profiles measured from the S2 cell wall layer in (a) KCl 75% RH and (b) CuCl2 75% RH specimens as a function of distance (x) and time (t). In the KCl 70% RH specimen (a), the average K C remained unchanged up to distance x = 0, and then increased with increasing t for x > 0. This behavior is indicative of infinite source diffusion. In the CuCl2 75% RH specimen (b), with increasing t the Cu C decreased for x < 0 and increased for x > 0. This behavior is indicative of finite source diffusion. For both series the C were measured at times 0, 23, 45, 68, 90, 112, 135, and 159 min. Each colored line represents one time, and the arrows point to increasing time. The indicated parameters Co and Cs were used in the diffusion constant analysis developed in the Supplementary Information and are described in the text.
