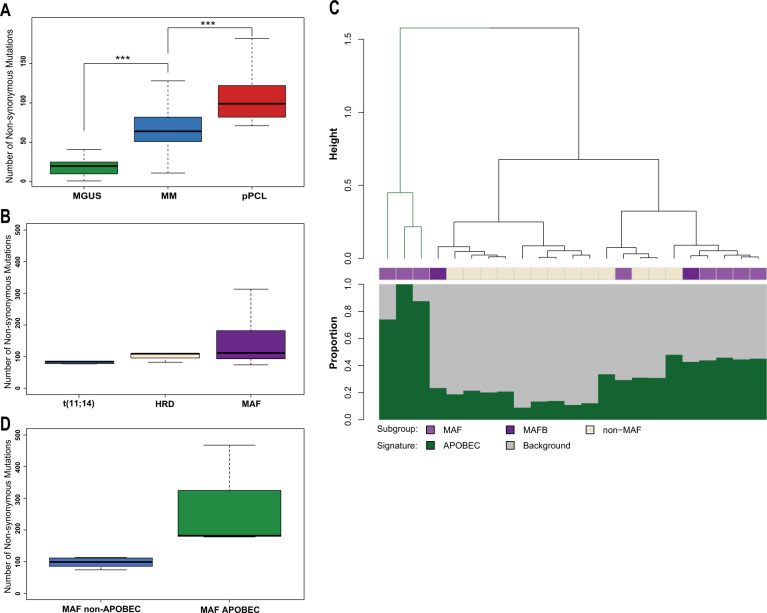
Fig. 2. Mutational burden and the prevalence of the APOBEC signature in pPCL.
a The median burden of nonsynonymous mutations increases with disease stage. pPCL (median 99, range 74–468), MGUS (median 20, range 1–66), and MM (median 64, range 11–2263), ***p < 0.001. b The prevalence of the APOBEC signature in the pPCL cohort. Only three patients (13% of total group and 33% of patients with MAF translocations) had a high percentage of the APOBEC signature, which is lower than reported in non-pPCL MM. c The amount of nonsynonymous mutations per cytogenetic subgroup is shown in (a). The median number of nonsynonymous mutations is relatively high in each subgroup: t(11;14) (median = 84, mean = 84), hyperdiploidy (HRD) (median = 104, mean = 100) and MAF including t(14;16) and t(14;20) (median = 112, mean = 171). There was no statistical significant difference between these groups. d The mutational load within the maf-subgroup between patients with a high APOBEC contribution compared to those with a not substantially increased APOBEC contribution.

