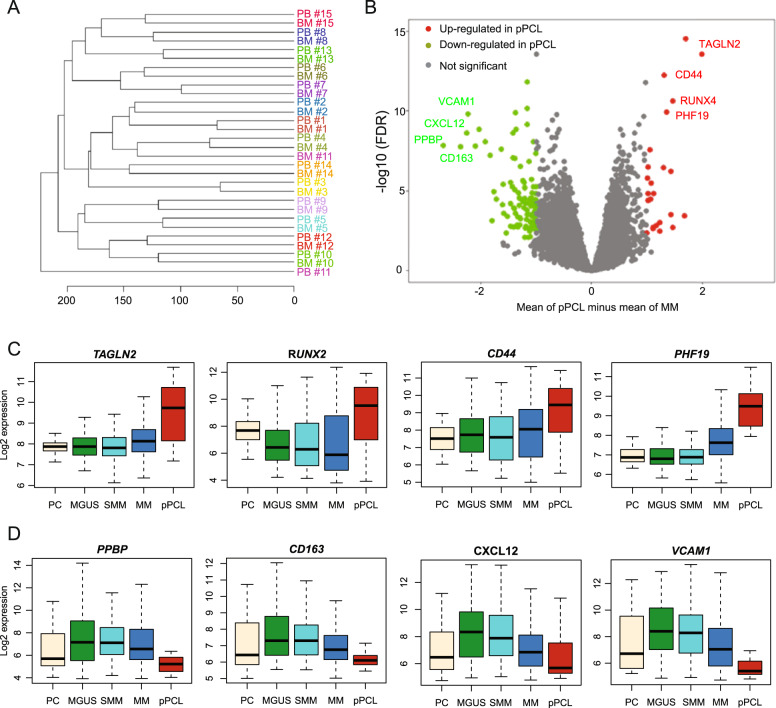
Fig. 3. Gene expression differences in pPCL.
a Unsupervised clustering of matched CD138+ cells from BM aspirates and PB from the same patients (n = 15). b Gene expression profiling comparing differentially expressed genes between non-pPCL MM and pPCL with at least a twofold change (p < 0.05, FDR < 0.01). c Expression of the top four upregulated genes by MM stage and in healthy donors (HD). d The top four downregulated genes by MM stage and in HD.

