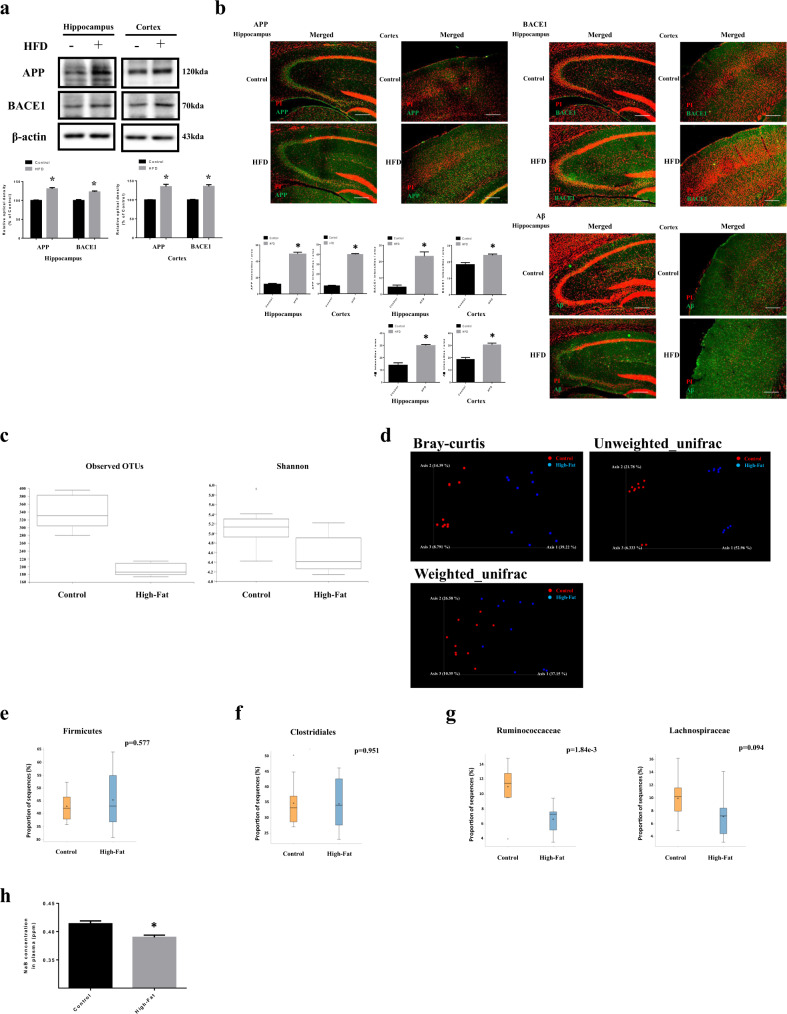
Fig. 1. BACE1 expression and Aβ accumulation in the brain of the obesity model and the alteration of the gut microbiota composition in the obesity model.
a Brains of 20 weeks old ICR mice, which were fed with HFD for 14 weeks were extracted. The extracted brains were cryo-sectioned coronally, and separated into hippocampus and cortex. The expression levels of APP, BACE1, and β-actin were analyzed by western blot. β-actin was used as a loading control. Data are presented as a mean ± S.E.M. n = 4. b Brain samples for immunohistochemistry were immunostained with APP, BACE1, and Aβ and PI. Images shown in result are representative. All scale bars, 25 µm (magnification, ×100) c Alpha diversity between control and high-fat; left panel: Observed OTUs, right panel: Shannon’s diversity index. d Beta diversity between control (•) and high-fat (•); Bray–Curtis, unweighted UniFrac distance, weighted UniFrac distance. e–g STAMP analysis; e Differences in relative abundance of firmicutes between groups at the phylum level, f Differences in relative abundance of clostridiales between groups at the order level, g Differences in relative abundance of ruminococcaceae and lachnospiraceae between groups at the family level. h The concentration of NaB in plasma of mice was measured by GC–MS. NaB concentration data are presented as a mean ± S.E.M. n = 4. *p < 0.05 versus control. All blot and immunofluorescence images shown are representative.

