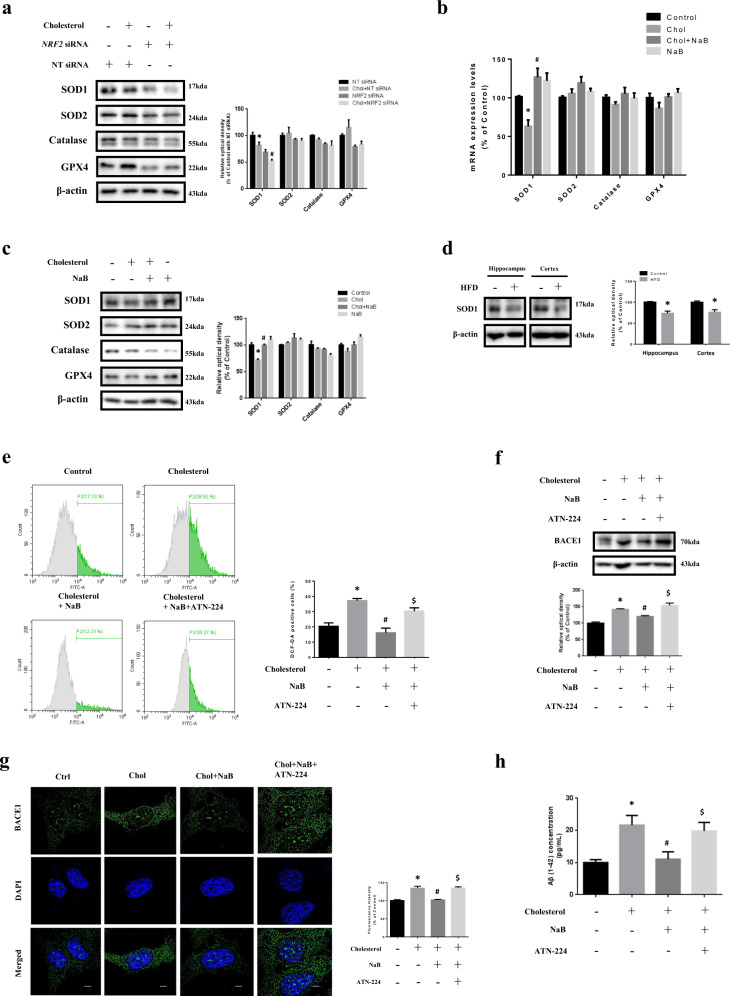
Fig. 6. Effect of NaB on high-cholesterol-induced ROS generation, BACE1 expression, and Aβ accumulation through SOD1 expression.
a SK-N-MC cells were transfected with NRF2 siRNA or NT siRNA for 24 h, and pretreated with NaB for 30 min prior to treatment of high cholesterol for 24 h. The expression levels of SOD1, SOD2, catalase, and GPX4 were analyzed by western blot. β-actin was used as a loading control. n = 3. *p < 0.05 versus control with NT siRNA transfection, #p < 0.05 versus high cholesterol treatment with NT siRNA transfection. b Cells were pretreated with NaB for 30 min prior to treatment of high cholesterol for 24 h. mRNA expression levels of SOD1, SOD2, catalase, and GPX4 were analyzed by quantitative real-time PCR. Data were normalized by the ACTB mRNA expression levels. n = 4. *p < 0.05 versus control, #p < 0.05 versus high cholesterol treatment. c Cells were pretreated with NaB for 30 min prior to treatment of high cholesterol for 24 h. The expression levels of SOD1, SOD2, catalase, and GPX4 were analyzed by western blot. β-actin was used as a loading control. n = 4. *p < 0.05 versus control, #p < 0.05 versus high cholesterol treatment. d Brains of 20 weeks mice fed with HFD for 14 weeks were extracted. The expression levels of SOD1 were analyzed by western blot. β-actin was used as a loading control. n = 3. *p < 0.05 versus control. e Cells were pretreated with NaB and ATN-224 (4 µM) for 30 min prior to treatment of high cholesterol for 72 h where ROS with DCF-DA was measured by flowcytometer. Total cell counts = 1.0 × 10⁴ cells. n = 4. f Cells were pretreated with NaB and ATN-224 for 30 min prior to treatment of high cholesterol for 24 h. The expression levels of BACE1 were analyzed by western blot. β-actin was used as a loading control. n = 4. g Cells were pretreated with NaB and ATN-224 for 30 min prior to treatment of high cholesterol for 24 h and immunostained with BACE1 antibody. Scale bars are 8 µm (magnification, × 1,000). n = 3. H Cells were pretreated with NaB and ATN-224 for 30 min prior to treatment of high cholesterol for 72 h. Aβ concentration of medium samples was detected by using ELISA kit. Data are presented as a mean ± S.E.M. n = 4. *p < 0.05 versus control, #p < 0.05 versus high cholesterol treatment, $p < 0.05 versus treatment of high cholesterol and NaB. All blot and immunofluorescence images shown are representative.

