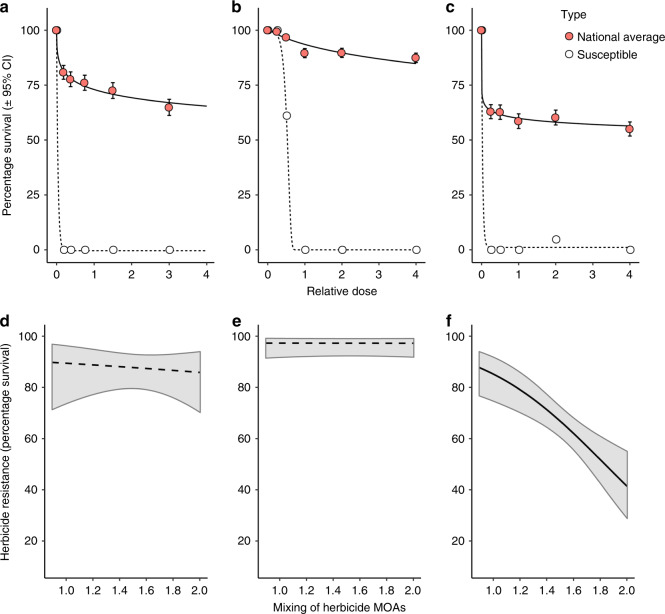
Fig. 1. Assessment of phenotypic herbicide resistance in UK A. myosuroides populations.
The fitted relationships between herbicide dose and plant survival are shown for (a) the ‘SU’ herbicide mesosulfuron, (b) the ‘Fop’ fenoxaprop and (c) the ‘Dim’ cycloxydim. Red filled circles and solid lines represent the mean response across all 132 field-collected populations, providing an estimate of the national level of resistance to these herbicides. For comparison, dotted lines and unfilled circles show the response in a herbicide susceptible standard population. Error bars show the 95% confidence interval about the mean. d–f show the predicted relationship between the historical intensity of herbicide mixtures applied to field-collected populations and population-level resistance (percentage survival following glasshouse resistance assays) to the SU, Fop and Dim herbicides, respectively. Fitted lines show the mean predicted relationship following mixed model analysis (see Supplementary Table 1), with shaded regions representing the 95% confidence interval. A solid black line is used for a significant relationship (f) (p ≤ 0.001), while dashed lines are used where the relationship was non-significant (d, e). Source data for panels (a–c) are provided as a Source Data file. Experiments were conducted once for each herbicide, screening 108 plants per population over six doses.

