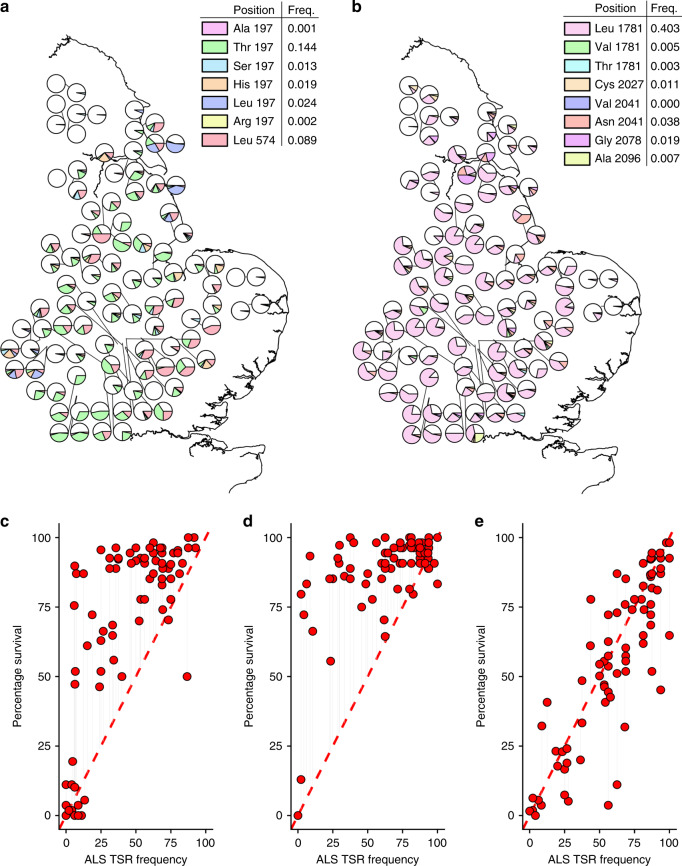
Fig. 2. Contribution of ALS and ACCase target-site mutations to herbicide resistance across UK A. myosuroides populations.
a, b Show the geographic distribution and relative frequency of amino acid substitutions in the ALS gene and ACCase gene, respectively. White portions of the pie charts show the frequency of wild-type sequence, while coloured portions represent the relative frequencies of each amino acid substitution. ‘Freq’ within the legend shows the overall allele frequency for each mutation across all tested populations. TSR genotype information was determined from ≥16 plants per population. Panels (c–e) show the observed proportion of individuals surviving herbicide (Y-axis) versus the proportion of individuals carrying a TSR resistance mutation (X-axis) for the ALS (SU), Fop and Dim herbicides, respectively. An expected 1:1 relationship is shown by the diagonal line. Points above the 1:1 line implicate the coexistence of TSR and NTSR mechanisms in respective populations. Source data are provided as a Source Data file.

