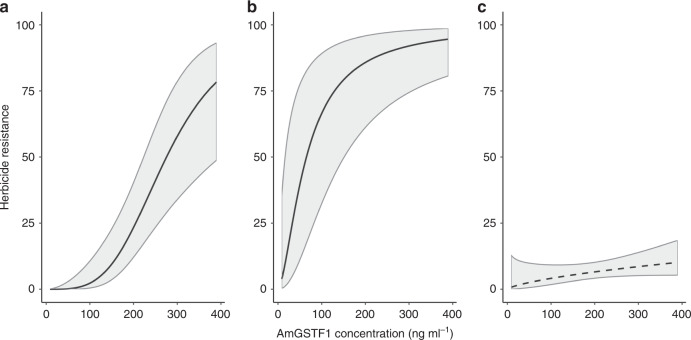
Fig. 3. Modelled relationship between population-level phenotypic herbicide resistance and the protein biomarker AmGSTF1 for the generalist NTSR mechanism.
X-axis shows the foliar concentration of the AmGSTF1 protein, while Y-axis represents herbicide resistance as the proportional (%) survival of individuals for (a) the ‘SU’ herbicide mesosulfuron, (b) the ‘Fop’ fenoxaprop and (c) the ‘Dim’ cycloxydim. Fitted lines show the mean predicted relationship following mixed model analysis given in Supplementary Table 2, with shaded regions representing the estimated 95% confidence interval of the prediction. The modelled response variable was the proportional survival of individuals (n = 18) over all doses of the tested herbicide. Terms for the target-site resistance frequency, AmGSTF1 concentration and their interaction were included as fixed factors, with each model containing random effect terms for the population ID and herbicide dose. Solid black lines are used for significant relationships in (a) (p ≤ 0.001) and (b) (p ≤ 0.001), while a dashed line is used where the relationship was non-significant in (c) (p = 0.10 ns).

