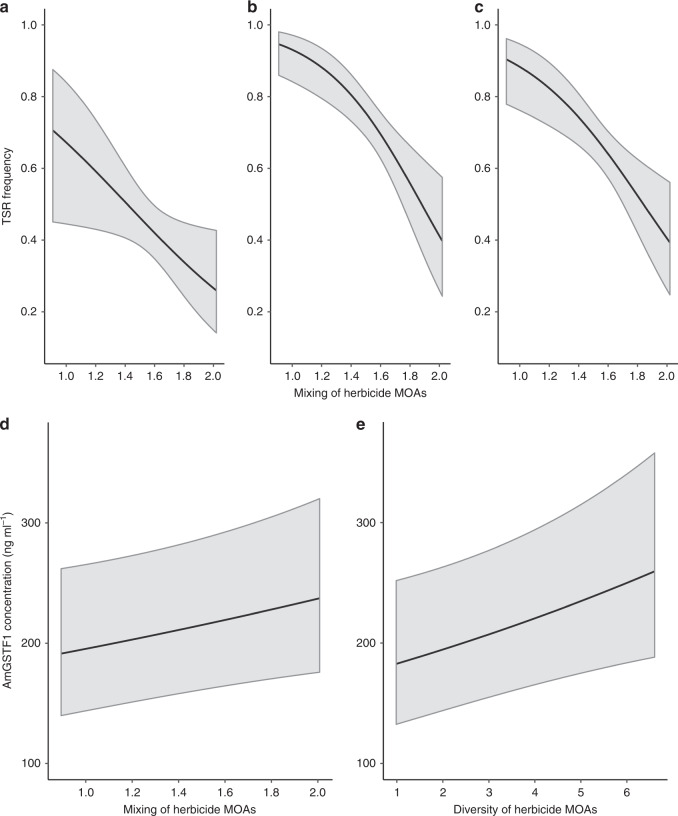
Fig. 4. The effect of historical herbicide mixing and diversity on selection for target-site (TSR) and non-target-site resistance (NTSR) mechanisms.
a–c show the mean predicted relationship between herbicide mixing and TSR frequency for the SU (p = 0.023), Fop (p ≤ 0.001) and Dim (p = 0.002) herbicides, respectively. Coefficients are from mixed model analyses fitted for each TSR separately (Supplementary Table 4). d The mean predicted relationship between the use of herbicide mode of action mixtures and the foliar concentration of AmGSTF1 (p = 0.040) (used here as a proxy for NTSR), and e the mean predicted relationship between the overall diversity of herbicide modes of action and the foliar AmGSTF1 concentration (p ≤ 0.001) following mixed model analysis are given in Supplementary Table 3. Solid lines show the mean predicted relationship, with shaded regions representing the 95% confidence interval of the prediction.

