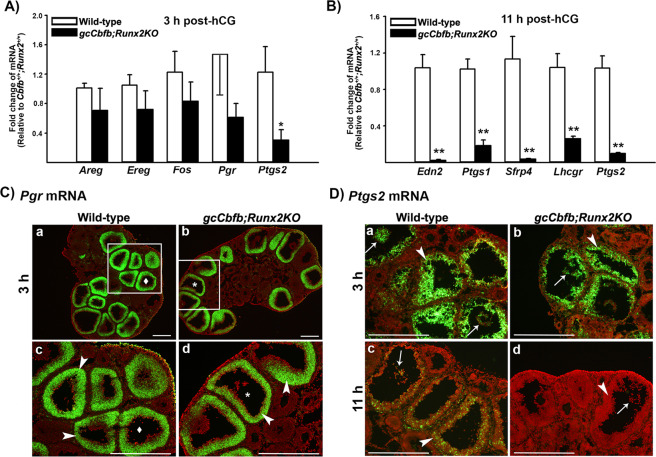
Figure 3.
The differential expression of key early and late ovulatory genes in ovaries of gcCbfb;Runx2KO mice. (A) Ovaries were collected at 3 h after hCG administration. The levels of mRNA for early ovulatory genes were measured by qPCR, normalizing to the Rpl19 value in each sample (n = 7 and 6 for control and mutant mice, respectively). *p < 0.05. (B) Ovaries were collected at 11 h after hCG administration. The levels of mRNA for late ovulatory genes were measured by qPCR, normalizing to the Rpl19 value in each sample (n = 8 and 7 for control and mutant mice, respectively). **p < 0.01. (C & D) The localization of Pgr mRNA and Ptgs2 mRNA was evaluated via in situ hybridization analyses in ovaries collected at 3 and 11 h post-hCG (n = 3/genotype). Green fluorescence staining represents transcripts for these genes. The tissue sections were counterstained with propidium iodide (red). Arrowheads and arrows point to granulosa cells of preovulatory follicles and expanded cumulus cells, respectively. Scale bars, 500 μm for all the images.

