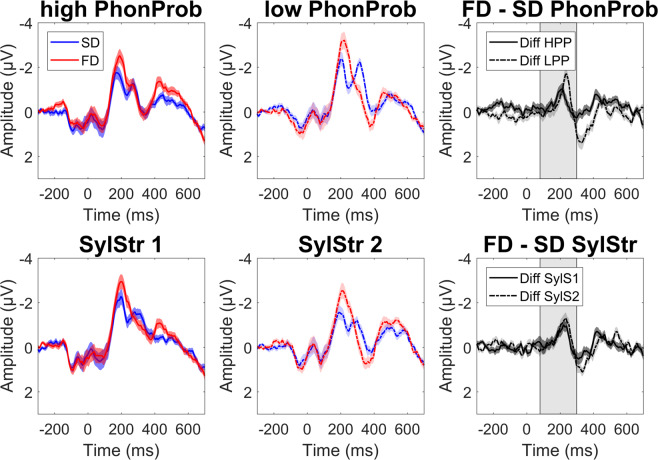
Figure 3.
Formal deviants. Grand average waveforms + /− SEM at frontocentral ROI, time-locked to /t/-onset. Top panel is averaged across syllable stress: high phonotactic probability (red: deviant, blue: standard), low phonotactic probability, and the difference waves (dark grey: high PhonProb, light grey: low PhonProb). The bottom panel is averaged across phonotactic probability: first syllable stress, second syllable stress, and difference waves (dark grey: SylStr1, light grey: SylStr2). Shaded area in difference waves represents window for MMN peak extraction.

