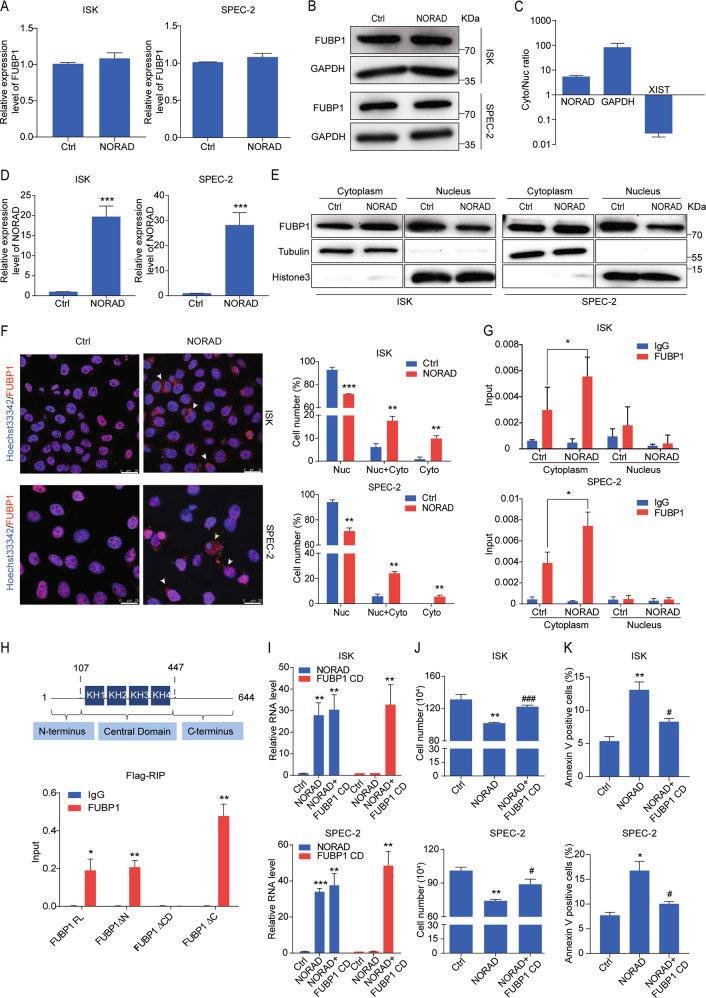
Fig. 5. NORAD impairs the nuclear localization of FUBP1 through its central domain.
a, b The FUBP1 expression level after the introduction of NORAD in ISK and SPEC-2 cells via qRT-PCR (a) and western blot (b). c The subcellular distribution of NORAD was analyzed by qRT-PCR. GAPDH and XIST genes were used as controls for the cytoplasmic and nuclear fractions, respectively. d The expression level of NORAD was detected by qRT-PCR. e The fractionation of FUBP1 was visualized by western blot after ectopic expression of NORAD in ISK and SPEC-2 cells. GAPDH and Histone 3 indicated the cytoplasmic and nuclear fractions, respectively. f Immunofluorescence assays indicated the altered localization of FUBP1 (red) after introduction of NORAD in ISK and SPEC-2 cells (left). Quantifications of the percentages of FUBP1 presented only in the nucleus, in the cytoplasm, and both in the nucleus and cytoplasm are shown (right). White arrows represented the cells which FUBP1 was distributed both in the cytoplasm and nucleus. Yellow arrows represented the cells in which FUBP1 was distributed only in the cytoplasm. Scale bar, 25 μm. g The subcellular fractionation followed by RIP assays was performed to analyze the interaction of NORAD and FUBP1 in the cytoplasmic and nuclear lysates of NORAD overexpressing cells. h qRT-PCR analysis of NORAD immunoprecipitated by Flag-tagged full-length and three deleted mutations of FUBP1 in 293FT cells compared with the IgG control. i The expression level of NORAD and FUBP1 CD truncation was detected by qRT-PCR. j Cell-counting assays of the rescued cell growth by FUBP1 CD in the NORAD-expressing ISK and SPEC-2 cells. k FACS analysis of the rescued percentage of apoptotic cells by FUBP1 CD in the NORAD-expressing ISK and SPEC-2 cells. The results were determined from triplicates, and the error bars represented as the mean ± SD, */#P < 0.05, **P < 0.01, ***/###P < 0.001. XIST X inactivation-specific transcript.

