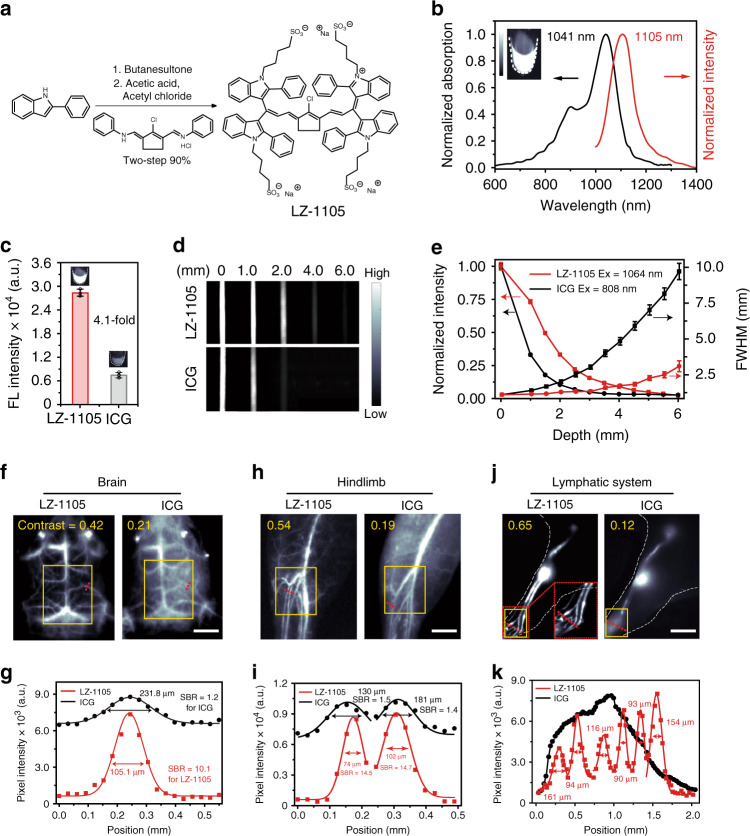
Fig. 1. Optical characterization of LZ-1105 and in vivo NIR-II imaging comparision by LZ-1105 and ICG.
a Synthetic route of LZ-1105. b Normalized absorption and fluorescence intensity of LZ-1105 in PBS, demonstrating an absorbance peak at 1041 nm and an emission peak at 1105 nm. The fluorescent emission spectrum was obtained under 1064 nm laser excitation. Inset: An NIR-II fluorescence image of LZ-1105 (10 μM) in PBS. c The fluorescence intensity of LZ-1105 and ICG in mice blood under 1064 nm (30 mW cm−2, 1400 nm long-pass filter) and 808 nm (30 mW cm−2, 1300 nm long-pass filter) laser excitation, respectively. Inset: NIR-II fluorescence image of LZ-1105 and ICG in mice blood ([LZ dyes] = [ICG] = 10 μM). NIR-II images (d), normalized signal intensity, and full width at half maximum (FWHM) (e) of LZ-1105 (top, λex = 1064, 1400 nm long-pass filter) and ICG (bottom, λex = 808, 1300 nm long-pass filter) through various thicknesses of 1% Intralipid solution. Equal fluorescent intensities of LZ-1105 and ICG at 0 mm were obtained by adjusting the laser’s working power density. Noninvasive NIR-II fluorescence images of brain (f), hindlimb (h), and lymphatic system (j) in nude mice (brain) and shaved ICR mice (n = 3) (lymphatic system and hindlimb) i.v. injected with LZ-1105 (1400 long-pass filter, λex = 1064 nm, 300 ms) or ICG (1300 long-pass filter, λex = 808 nm, 300 ms) (inset in j shows a magnified view of the red grid, contrast was calculated in the yellow box). g, i, k The fluorescence intensity profiles (dots) and Gaussian fit (lines) along the red dashed line in brain (f), hindlimb (h), and lymphatic system (j). Data point with its error bar stands for mean ± s.d. derived from n = 3 independent experiments. Scale bars in f, h, and j represent 3 mm. Source data underlying c, e, g, i, and k are provided as a Source Data file.

