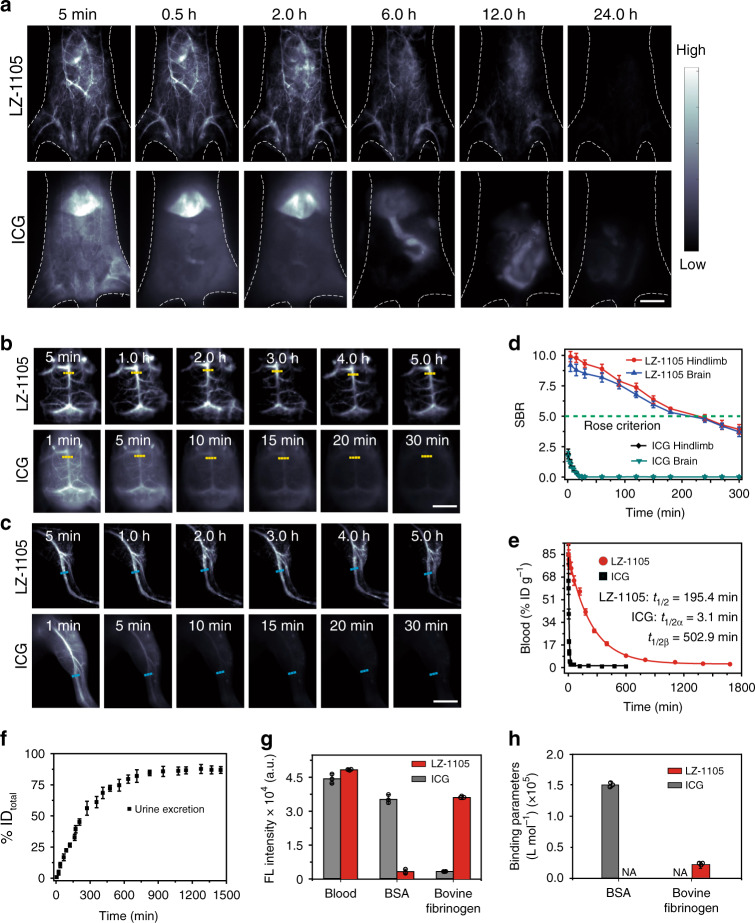
Fig. 2. Pharmacokinetics and blood retention of LZ-1105 and ICG.
NIR-II bioimaging of mice body (a), brain (b), and hindlimb (c) after i.v. injected with LZ-1105 (1400 nm long-pass, λex = 1064 nm, 300 ms) and ICG (1300 nm long-pass, λex = 808 nm, 300 ms). d The corresponding signal-to-background ratio (SBR) of LZ-1105 and ICG administrated mice along the yellow and cyan dashed line in b and c as a function of time. The green dotted line indicates the Rose criterion. e Blood circulation (%ID g−1) of LZ-1105 and ICG administrated mice as a function of time. f Cumulative urine excretion curve for LZ-1105 injected mice within 24 h p.i. g NIR-II signal intensity of LZ-1105 and ICG with different excitations and long-pass filters. (1064 nm excitation and 1400 nm long-pass filters for LZ-1105, 808 nm excitation and 1300 nm long-pass filters for ICG. Excitation power was adjusted to obtain comparable NIR-II signal in mice blood. [LZ-1105] = [ICG] = 10 μM) h The binding parameters of LZ-1105 and ICG with bovine serum albumin (BSA) and bovine fibrinogen by isothermal titration calorimetry (ITC) at 20 °C. N/A means not measureable by ITC. n = 3 independent mice experiments for a–c. Data point with its error bar stands for mean ± s.d. derived from n = 3 independent experiments for d–h. Scale bars in a, b, and c represent 4 mm. Source data underlying d, e, f, g, and h are provided as a Source Data file.

