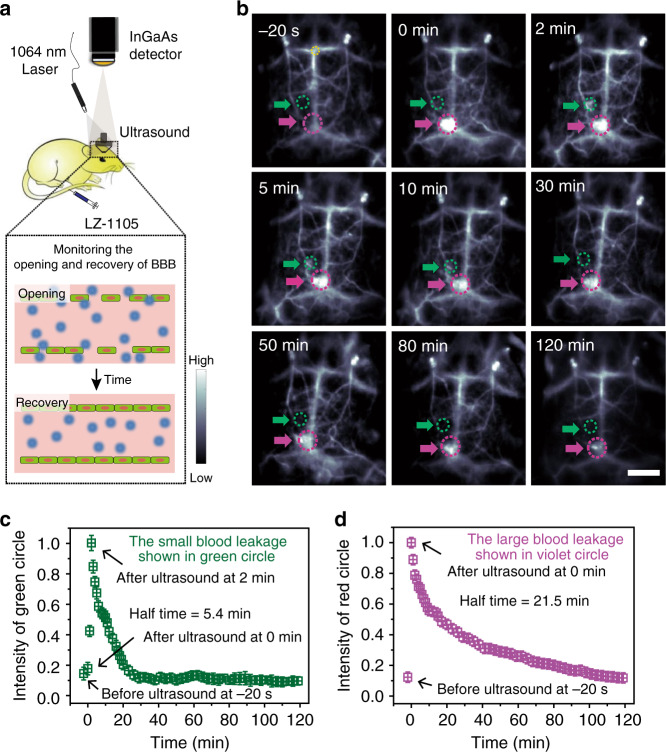
Fig. 5. Real-time noninvasive NIR-II imaging to monitor the opening and recovery of the blood–brain barrier (BBB).
a Schematic illustration of the NIR-II imaging setup to monitor the opening and recovery of the BBB. b The NIR-II images of the mice brain before and after treated with focused ultrasound (FUS) and microbubbles at different time points (n = 3 mice). The green and violet circles and arrows indicate the opening and recovering points of cerebral vessels. Corresponding normalized mean signal intensity of green (c) and violet a (d) circles as a function of time. The fluorescence intensity region (noted as the yellow circle) of each images was normalized to measure the signal intensity decreasing process of the leakage on the brain vessels. Data point with its error bar stands for mean ± s.d. derived from n = 3 replicated measurements. Scale bar represents 4 mm. Source data underlying c and d are provided as a Source Data file.

