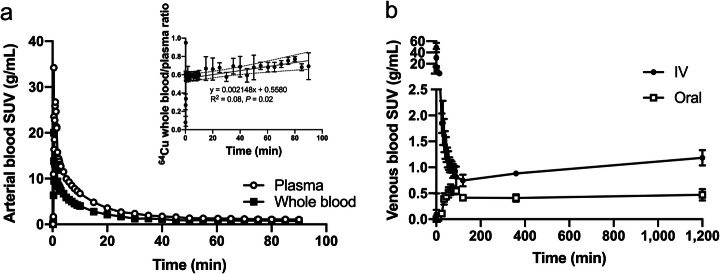
Fig. 3.
Time courses of the concentration of 64Cu in blood following administration intravenous (IV) and oral administration. Panel a shows SUV in arterial whole blood (closed circles) and plasma (open circles) following the initial 90 min after IV administration of 64Cu (n = 3; for clarity, no error bars are displayed); displayed as insert is the ratio between radioactivity concentration in whole blood and plasma. Panel b shows SUV in venous whole blood following IV and oral administration of 64Cu (n = 4 and n = 2, respectively). Values are given as group means ± SD

