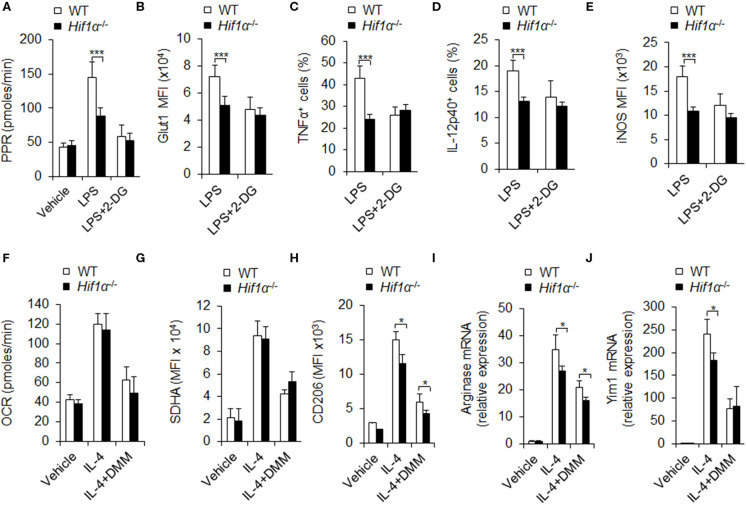
Figure 5.
HIF1α-dependent glycolysis is associated with M1 and M2 macrophage polarization. Peritoneal macrophages (PEMs) sorted from WT mice pretreated with glycolysis inhibitor 2-DG (1 mM) or DMM (10 mM) for 1 hr were stimulated with LPS (100 ng/mL) for 12 h or IL-4 for 48 h. Cell glycolysis were measured by extracellular acidification rate (A). The protein expression of Glut 1 (B), intracellular staining of TNFα and IL-12p40 (C,D) and iNOS expression (E) were determined by flow cytometry. Cellular OXPHOS activity was measured by monitoring the OCR of cells (F). The expression of SDHA (G) and CD206 (H) were determined by flow cytometry. mRNA expression of Arginase I (I) and Yim1 (J) were determined by qPCR. Representative results are based on one of three independent experiments performed with similar results. The data are presented as the mean ± SD (n = 3–5 mice per group). Student's unpaired t test for comparisons between two groups. *P < 0.05 and ***P < 0.001, compared with the indicated groups.

