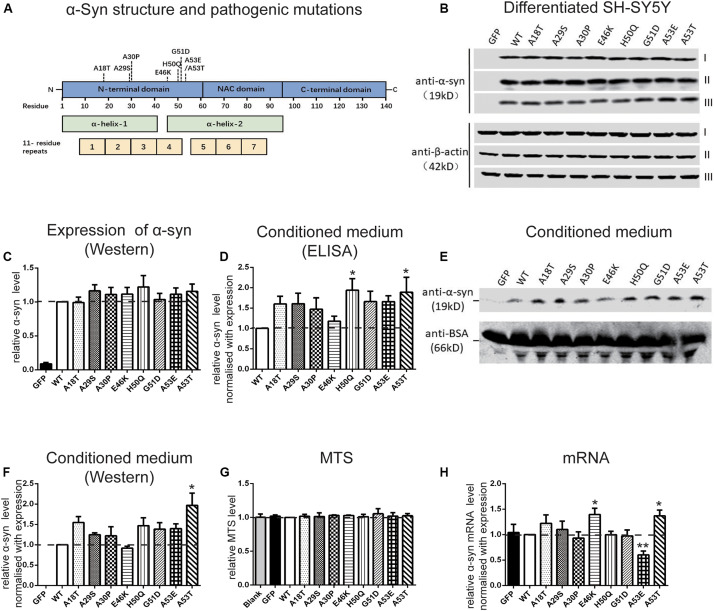
FIGURE 1.
Pathogenic mutations increase α-syn secretion in differentiated SH-SY5Y cells. (A) Schematic of pathogenic mutations of α-syn. (B,C) Immunoblots (B) and analysis (C) of cell lysates (n = 7 independent cultures, results of three experiments are shown). (D–F) Immunoblots (n = 4 independent cultures) and ELISA analysis (n = 7 independent cultures) of conditioned medium. (G,H) Normalized MTS levels (G) and mRNA levels quantified by qRT-PCR (H) (n = 4 independent cultures). Mean ± SEM; *P < 0.05, **P < 0.01, one-way ANOVA followed by Dunnett’s test compared to WT.

